Figure 6.
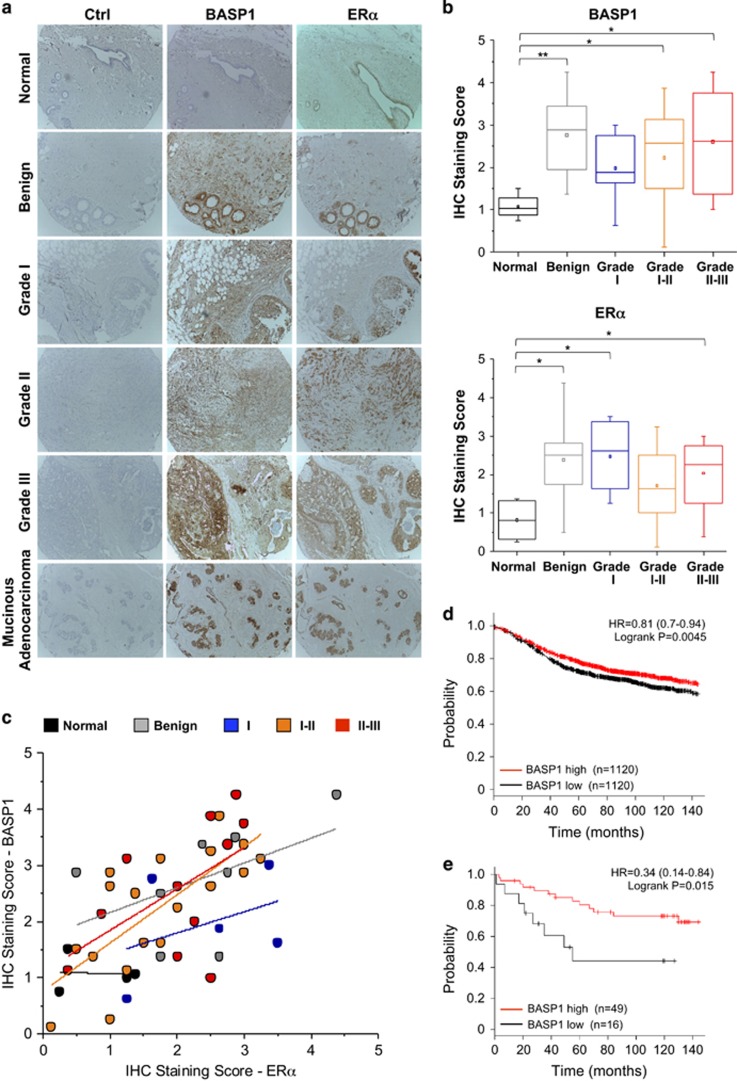
BASP1 is expressed in human breast cancer. (a) Representative images of IHC stained breast cancer tissue samples of each cancer subtype stained using BASP1 and ERα antibodies, and control samples (Ctrl). Benign tumour sample has fibrotic changes. Grade I tumour is a ductal carcinoma in situ and grade II and III are invasive ductal cell carcinomas. Samples were scored for BASP1 and ERα between 0 (no expression) and 5 (high expression) independently by four observers. (b) Box and whisker plots of median BASP1 (upper panel) and ERα scores by subtype. Data were analysed by one-way ANOVA with Bonferroni’s post-hoc analysis to show that the level of BASP1 in the normal samples was significantly less than the benign sample or tumours. T-test values are shown (*P<0.05, **P<0.01). (c) Scatter plot of mean BASP1 and ERα IHC scores for individual normal and tumour samples with a best line fit for each category. (d) Kalpan–Meier plot of ER-positive breast cancer analysing BASP1 expression against probability of relapse-free survival (n=2240). (e) Kaplan–Meier plot of ER-positive breast cancer patients that were treated with tamoxifen alone comparing BASP1 expression against probability of overall survival (n=65)

