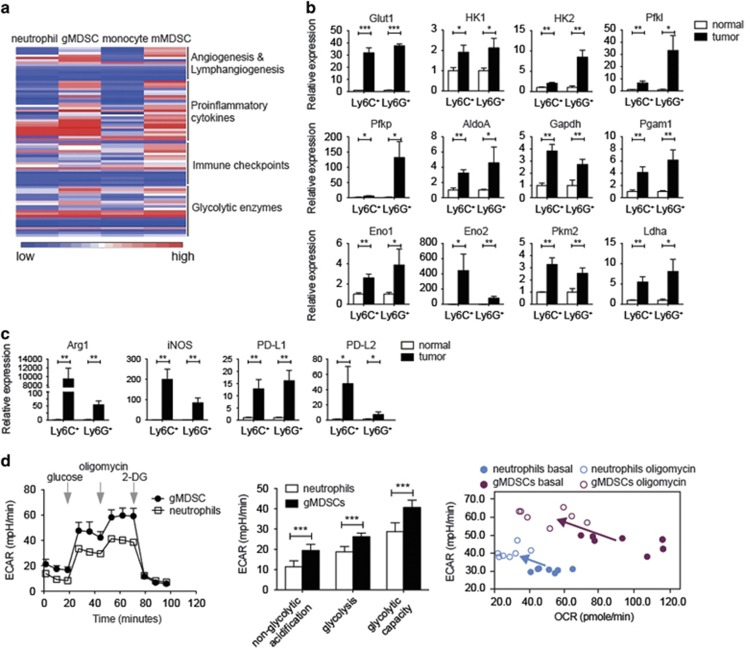
Figure 2.
Metabolic status in myeloid cells during tumor progression. (a) Heat map summarizing the gene expression data from cDNA microarray. mRNA levels of genes of interest in splenic neutrophils, monocytes from normal healthy mice, gMDSCs and mMDSCs from tumor site of 4T1-tumor-bearing mice were shown. (b) Quantitative real-time PCR analysis of gene expression of glycolytic enzymes in FACSorted CD11b+Ly6C+ and CD11b+Ly6G+ cells from tumor sites of 4T1-tumor-bearing mice and spleens from normal BALB/c mice (n=3 per group). (c) Quantitative real-time PCR analysis of ARG1, NOS2, PDCD1LG1 and PDCD1LG2 in FACSorted CD11b+Ly6C+ and CD11b+Ly6G+ cells from tumor sites of 4T1-tumor-bearing mice and spleens from normal BALB/c mice (n=3 per group). (d) ECAR of FACSorted splenic gMDSCs from 4T1-tumor-bearing mice and splenic neutrophils from normal BALB/c mice (left panel); calculated non-glycolytic acidification, glycolysis and glycolytic capacity of the cells (middle panel); ECAR versus OCR of the above cells under basal condition and oligomycin treatment (right panel, n=7 per group). All the data are representative of two independent experiments. *P<0.05, **P<0.01 and ***P<0.001 (unpaired Student’s t-test). (b–d) Error bars, S.D.

