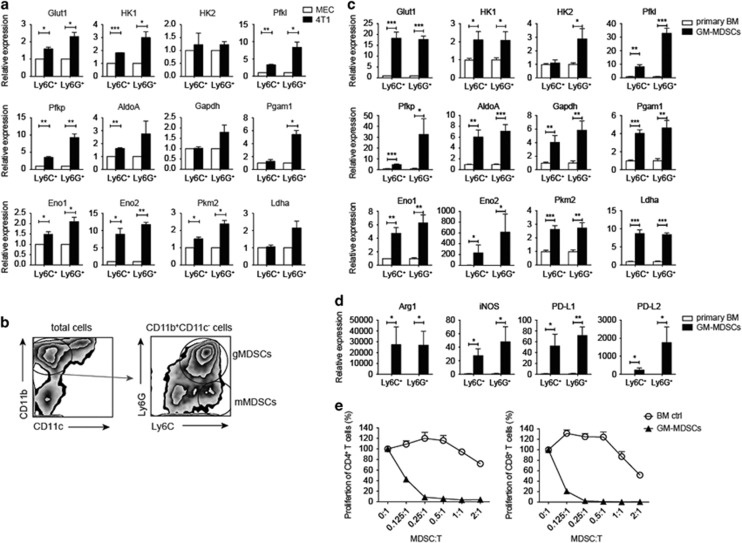
Figure 3.
In vitro induction of MDSCs. (a) Quantitative real-time PCR analysis of gene expression of glycolytic enzymes in purified bone marrow neutrophils and monocytes after incubation with 4T1-tumor cells or with primary MECs for 40 h. (b) Representative flow cytometric zebra plots of MDSCs induced from bone marrow cells in the presence of GM-CSF for 5 days. CD11b and CD11c expression (left) of the total cells and Ly6C and Ly6G expression (right) of gated CD11b+CD11c− cells were shown. (c) Quantitative real-time PCR analysis of gene expression of glycolytic enzymes in FACSorted GM-CSF-induced (GM-MDSCs) or bone marrow (primary BM) CD11b+CD11c−Ly6C+ and CD11b+CD11c−Ly6G+ cells (n=3 per group). (d) Quantitative real-time PCR analysis of ARG1, NOS2, PDCD1LG1 and PDCD1LG2 in the cells in (c) (n=3 per group). (e) Proliferation of CD4+ (left) and CD8+ (right) T cells cocultured with different numbers of MACSorted fresh bone marrow CD11b+ (BM ctrl) or MACSorted GM-CSF-induced CD11b+ MDSCs (GM-MDSCs). The percentage of the proliferating CD4+ (left panel) and CD8+ (right panel) T cells was calculated by dividing the number of EdU+ cells of each well by the average number of EdU+ cells in wells without MDSCs (as 100%). All the data are representative of two independent experiments. *P<0.05, **P<0.01 and ***P<0.001 (unpaired Student’s t-test). (a and c–e) Error bars, S.D.

