Figure 4.
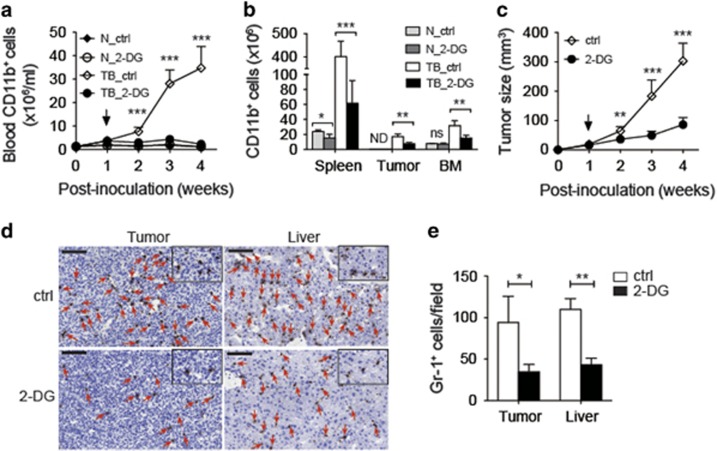
The in vivo accumulation of MDSCs was dependent on glycolysis. (a) Counts of CD11b+ cells in the blood of PBS-treated (ctrl) or 2-DG-treated normal (N) and 4T1-tumor-bearing (TB) mice at indicated time points after tumor inoculation. Arrow indicated the time point starting 2-DG treatment (n=3 per group). (b) Absolute numbers of CD11b+ cells in the indicated tissues of the mice in (a) at the fourth week after tumor inoculation (n=3 per group). (c) Size of tumor in the PBS-treated (ctrl) and 2-DG-treated tumor-bearing mice measured at the indicated time points (n=6–7 per group). (d) Immunohistochemical staining for detection and (e) quantification of Gr-1+ cells in the tumor and the liver of the PBS-treated (ctrl) and 2-DG-treated tumor-bearing mice at week 4 after tumor inoculation. Arrowheads indicated Gr-1+ cells (n=3 per group). Scale bars, 100 μm. All the data are representative of two independent experiments. ND, not done; ns, not significant. *P<0.05, **P<0.01 and ***P<0.001 (unpaired Student’s t-test). (a–c and e) Error bars, S.D.

