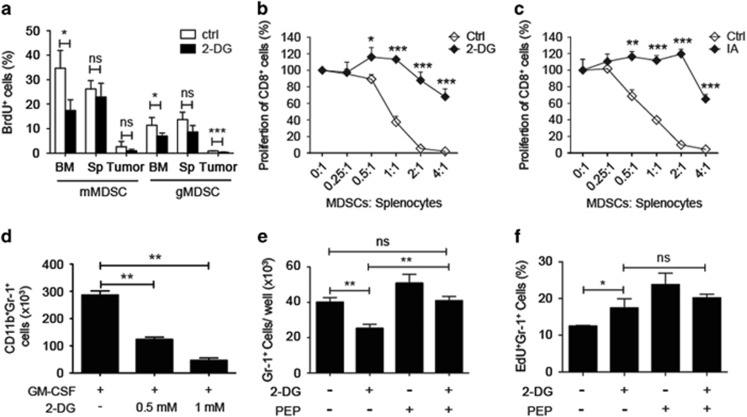
Figure 5.
The expansion of MDSCs was dependent on glycolysis. (a) Percentage of BrdU+ cells among mMDSCs and gMDSCs from the bone marrow (BM), spleen (Sp) and tumor site of the PBS-treated (ctrl) and 2-DG-treated 4T1-tumor-bearing mice (n=3 per group). (b) Proliferation of CD8+ T cells cocultured with different numbers of splenic PBS (ctrl)-, 2-DG-treated CD11b+ MDSCs from 4T1-tumor-bearing mice. (c) Proliferation of CD8+ T cells cocultured with different numbers of splenic PBS (ctrl)-, IA-treated CD11b+ MDSCs from 4T1-tumor-bearing mice. (d) Cell numbers of CD11b+Gr-1+ MDSCs recovered from the MDSC induction culture 5 days after induction using 20 ng/ml of GM-CSF in the presence or absence of 2-DG in 24-well plates. (e) Cell numbers of CD11b+Gr-1+ MDSCs recovered from the MDSC induction culture 3 days after induction using 20 ng/ml of GM-CSF in the presence or absence of 0.5 mM 2-DG and PEP (5 mM) in 96-well plates. (f) Percentage of proliferating CD11b+Gr-1+ MDSCs among the cells from (e). All the data are representative of two independent experiments. ns, not significant. *P<0.05, **P<0.01 and ***P<0.001 (unpaired Student’s t-test). (a–f) Error bars, S.D.

