Figure 1.
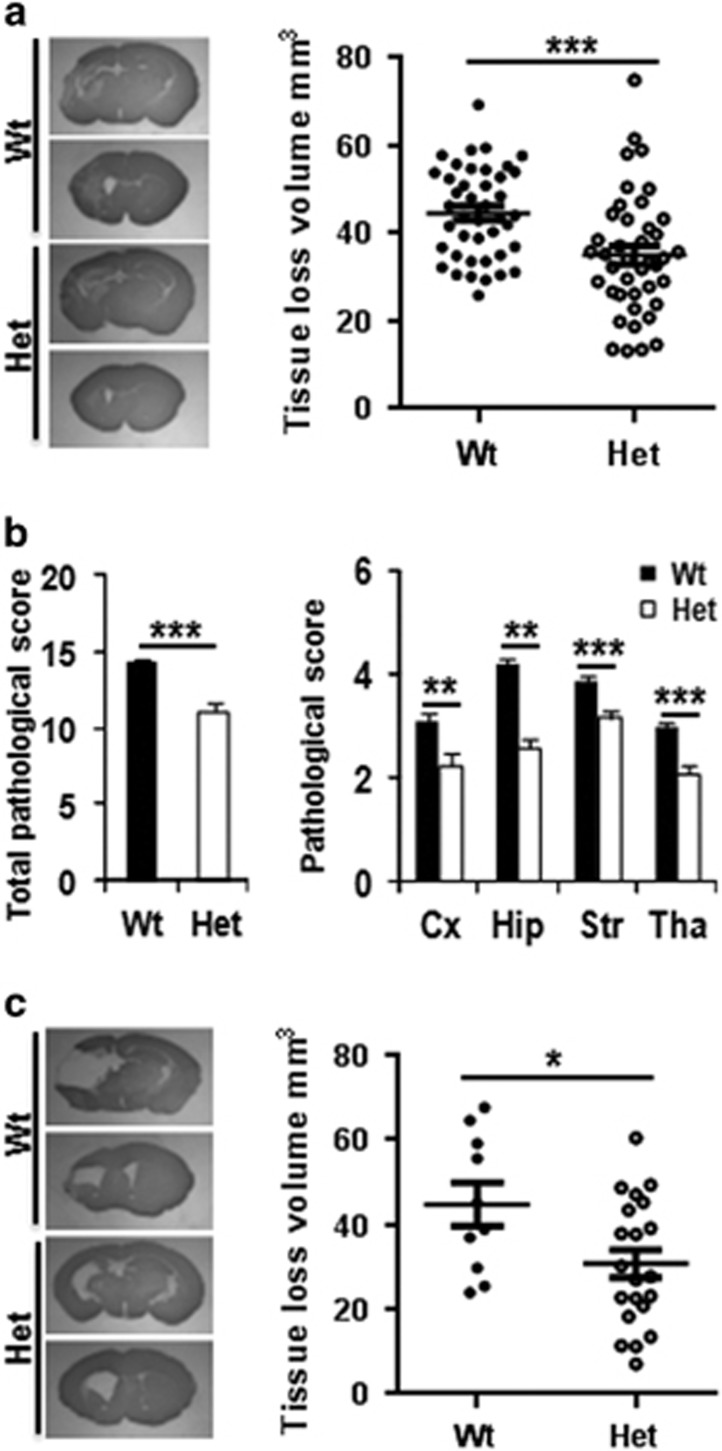
CHCHD4 deficit confers protection against HI brain injury. (a) The photomicrographs (left) show representative MAP2 staining obtained 72 h after HI at the dorsal hippocampus and the striatum levels. The graph (right) shows the total tissue loss 72 h after HI (n=42 for Wt and n=41 for Het). (b) The bar graphs show the total pathological score and the pathological scores in the cortex (Cx), hippocampus (Hip), striatum (Str), and thalamus (Tha) in Wt and Het mice at 72 h after HI. (c) The microphotographs show representative MAP2 staining at 4 weeks after HI from the dorsal hippocampus and the striatum levels. The graph shows the tissue loss at 4 weeks after HI (n=10 for Wt and n=21 for Het). *P<0.05, **P<0.01, ***P<0.001

