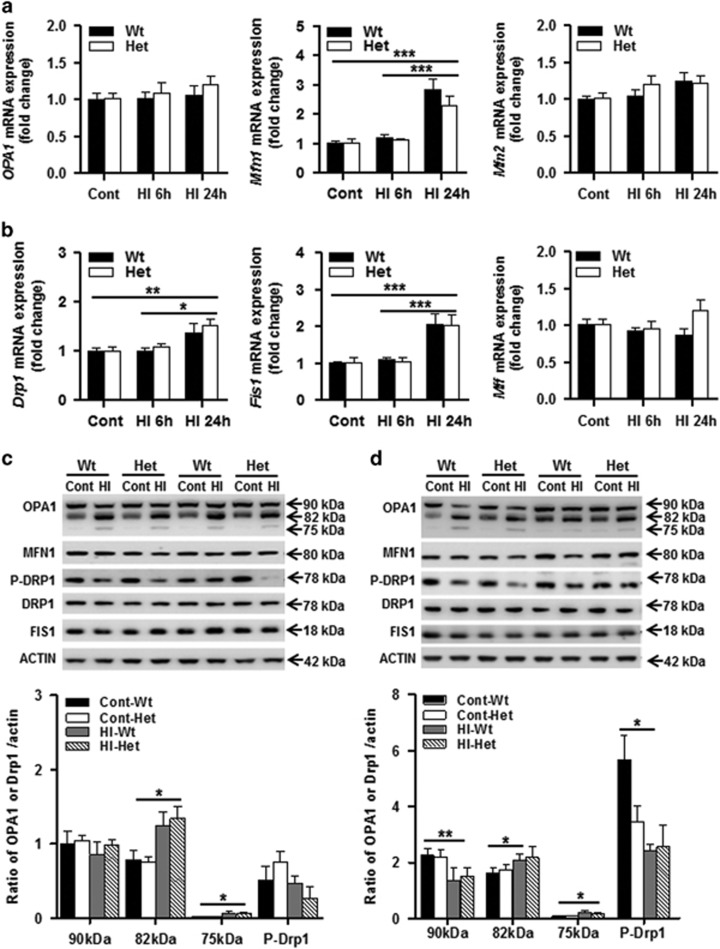
Figure 5.
Mitochondrial fission and fusion. (a) The mRNA expression levels of the mitochondrial fusion genes (Opa1, Mfn1, and Mfn2) in Wt and Het mouse brains were quantified by RT-qPCR at 6 and 24 h after HI. (b) The mRNA expression levels of the mitochondrial fission genes (Drp1, Fis1, and Mff) in Wt and Het mouse brains were quantified by RT-qPCR at 6 and 24 h after HI. n=6 per group. (c) Immunoblotting of OPA1, MFN1, P-DRP1, and FIS1 in the homogenate of Wt and Het control (Cont), and at 6 h after HI. The 90 kDa upper band of OPA1 was not significantly changed at 6 h after HI, while the 82 kDa lower band and 75 kDa cleavage band increased significantly at 6 h after HI. The 82 kDa lower band increased significantly after HI compared with controls. The 75 kDa cleavage band increased significantly after HI. There was no significant change for MFN1, P-DRP1, or FIS1 between Wt and Het in either control or HI mice (n=6 per group). (d) Immunoblotting of OPA1, MFN1, P-DRP1, and FIS1 in the mitochondrial fraction of Wt and Het controls, and at 24 h after HI. The expression of 90 kDa OPA1 decreased significantly at 24 h after HI in both Wt and Het compared with the controls. The 75 kDa cleavage band of OPA1 increased significantly after HI, but there was no difference between Wt and Het in either controls or HI. P-DRP1 decreased after HI in the Wt mice compared with their controls, but no significant reduction in Het mice. There was no significant change for MFN1 or FIS1 (n=6 per group). *P<0.05, **P<0.01, ***P<0.001

