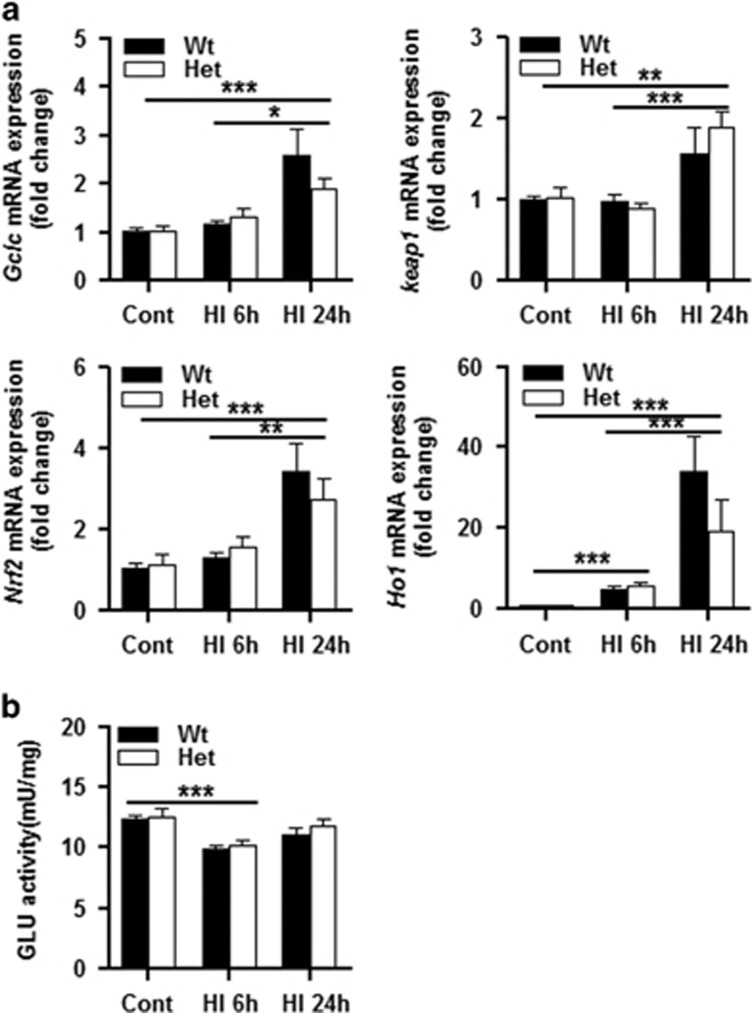
Figure 6.
Transcription of Keap1–Nrf2 pathway-related genes. (a) Nrf2, Keap1, Gclc, and Ho1 mRNA levels were quantified by qRT-PCR in P9 normal brain tissue as well as at 6 and 24 h after HI in Wt and Het mice (n=6 per group). No significant changes were observed between the genotypes. (b) Glutathione reductase (GLU) activity in the mitochondrial fraction was decreased at 6 h after HI compared with controls, and there was no significant difference between the genotypes under physiological conditions or after HI insult. *P<0.05, **P<0.01, ***P<0.001

