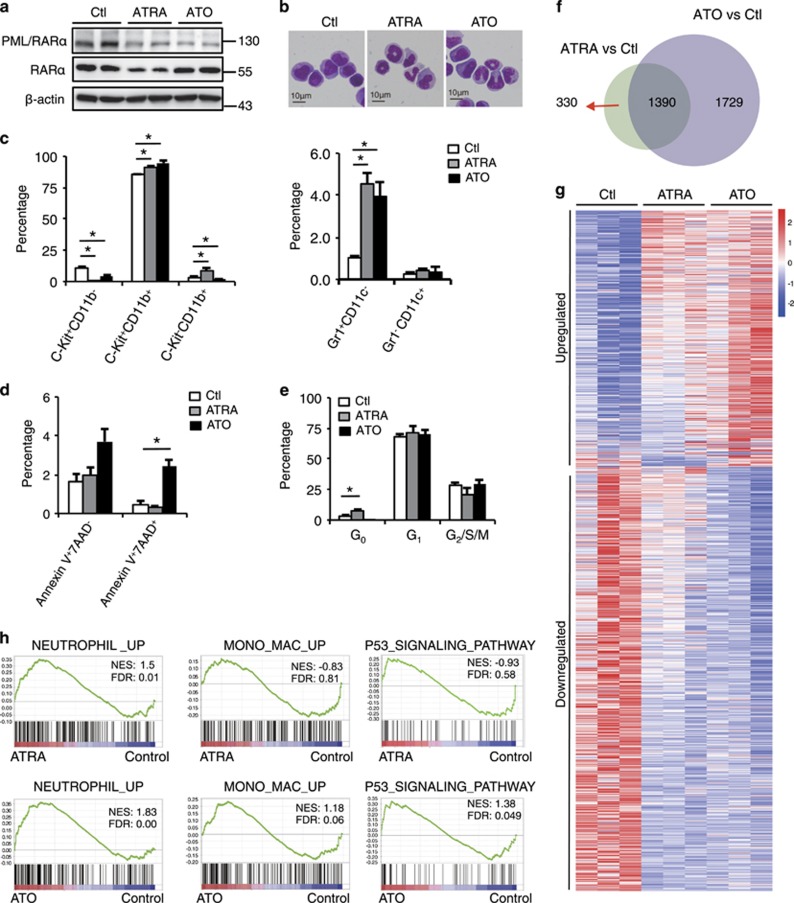
Figure 1.
Global gene expression alterations in APL cells after ATRA or ATO treatment in vivo. (a-e) FVB/NJ mice were each injected intravenously with 1 × 10⁶ GFP+ syngeneic APL BM cells. At the overt leukemia phase, the recipients were treated with or without daily intraperitoneal injection of ATRA (10 mg/kg) or ATO (4 mg/kg) for 6 days, and the BM GFP+ APL cells from each group were sorted and analyzed. (a) Western blotting assay for RARαand PML/RARα protein levels using anti-RARα and anti-PML antibodies. (b) Microscopic inspection of the sorted APL cells with Wright–Giemsa staining. (c–e) Statistic results of flow cytometry analyses of the expressions of c-Kit, CD11b, Gr-1 and CD11c for myeloid differentiation (c), Annexin V and 7AAD for cell survival (d), and HO33342 and Ki67 for cell cycle (e). (f) RNA sequencing showing the numbers and overlap of the differentially expressed (DE) genes between the ATRA-treated APL cells versus the control group and the ATO-treated APL cells versus the control group (P<0.05, fold change ≥1.5 and n=3). (g) Heatmap of the total DE genes altered by ATRA or ATO treatment. (h) GSEA analysis of the in vivo effects of ATRA or ATO on APL cells. The gene sets of neutrophil-associated upregulated, monocyte/macrophage-associated upregulated and P53 signaling pathway signatures were used, and the expression profiles of ATRA-treated versus control APL cell were shown in the upper panel, whereas the ATO-treated versus control APL cell were shown in the bottom panel. All data in this figure are presented as the mean±S.D., *P <0.05, **P<0.01

