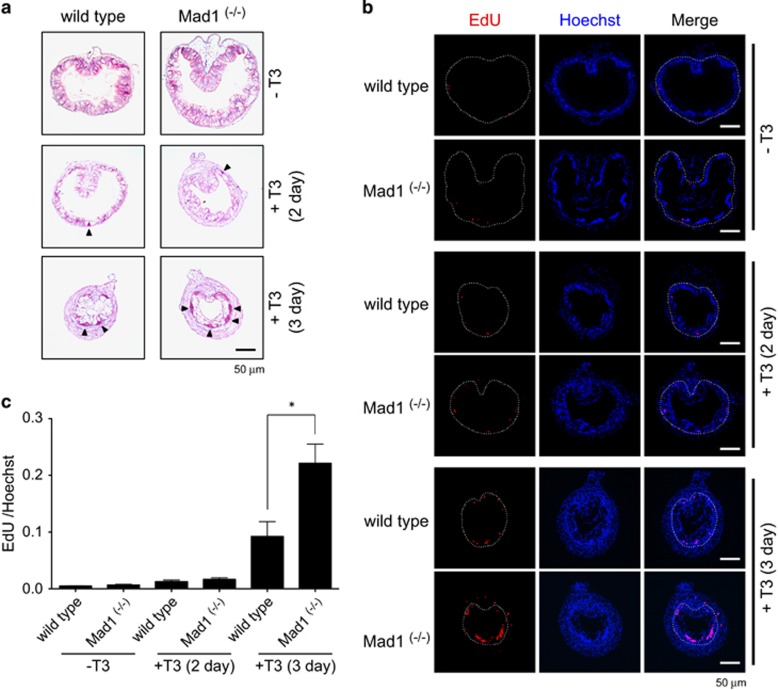
Figure 7.
Mad1 knockout enhances intestinal epithelial cell proliferation during T3-induced metamorphosis. Premetamorphic stage 54 tadpoles were treated with 5 nM T3 for 0, 2 or 3 days and were killed 30 min after EdU injection. (a) Cross-sections of the intestine from the resulting tadpoles were stained for MGPY. Note there were more epithelial cells in clusters strongly stained by MGPY in the cross-sections of the intestine from Mad1 (−/−) tadpoles treated with T3 for 3 day compared with wild-type ones. Arrowheads indicate the clusters of epithelial cells. (b) Cross-sections of the intestine from the tadpoles were double-stained for EdU (cell proliferation) and with Hoechst (DNA). Again, there are more EdU-positive epithelial cells in clusters in the T3-treated Mad1 (−/−) tadpole intestinal cross-sections compared with the wild-type ones. The dotted lines depict the epithelium–mesenchyme boundary. Scale bar, 50 μm. (c) Cell proliferation is significantly increased in Mad1 (−/−) tadpoles treated with T3 for 3 day compared with wild-type ones. Red colored EdU positive areas in epithelium were measured and normalized against the total cellular area in epithelium determined by Hoechst staining. The statistical significance of the differences was determined by Student’s t-test (*P<0.05)

