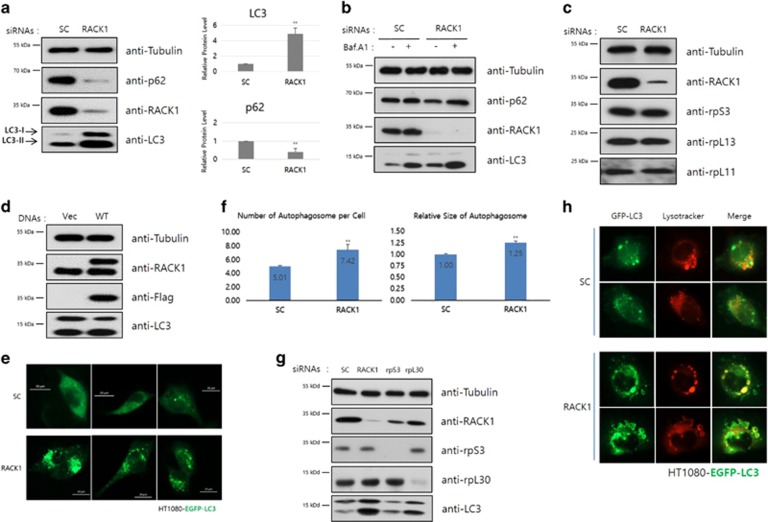
Figure 1.
(a) HT1080 cells were transfected with control or RACK1 siRNAs (50 pmol), and then incubated for 48 h. The cell lysates were subjected to immunoblot analysis using the indicated antibodies. LC3-II and p62/SQSTM1 are markers of autophagic flux (left panel). Intensities of LC3 and p62 proteins were normalized against that of tubulin proteins, and the relative expressions in RACK1 siRNA-treated cells compared with that in control cells was plotted (right panel). **P<0.01 (Student’s t-test). (b) Extracts of siRNA-transfected cells were pretreated with Bafilomycin A1 (1 μM) for 1 h, and subjected to immunoblot analysis using the indicated antibodies. (c) Each siRNA-treated HT1080 cells were lysed and extracts were subjected to immunoblot analysis using the indicated antibodies. (d) Immunoblot analysis using the indicated antibodies was performed after transient transfection of plasmids, pcDNA3-Flag vector or pcDNA3-Flag-RACK1 (WT) into HT1080 cells. (e and g) Indicated siRNAs (50 pmol) were transfected into EGFP-LC3 stable HT1080 cells. GFP-LC3 dots were detected by fluorescence microscopy (e), and the cell lysates were analyzed by immunoblotting using the indicated antibodies (g). (f) HT1080 cells were transfected with control or RACK1 siRNAs (50 pmol), CYTO-ID Green Detection Reagent is added, and then detected and analyzed. **P<0.01 (Student’s t-test). (h) After 48 h, GFP-LC3 stable HT1080 cells were treated with control or RACK1 siRNA (50 pmol), and then incubated with 50 nM LysoTracker for 30 min. After washing with PBS, images were obtained by florescence microscopy. The merged yellow signals of LysoTracker (red) and GFP-LC3 (green) indicated the autophagolysosome, which is formed by fusion of the lysosome and autophagosome

