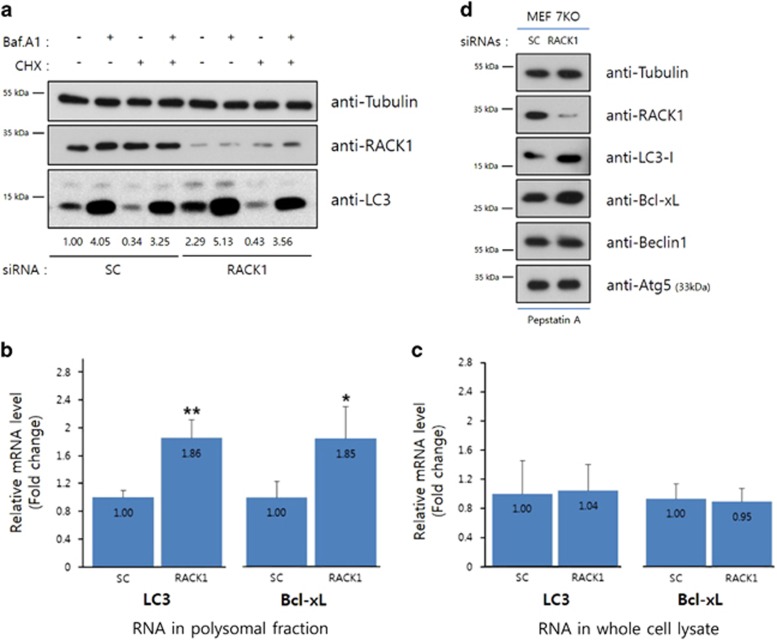
Figure 5.
Increment of LC3 and Bcl-xL occurs at the translational level. (a) Control or RACK1 siRNA-transfected cells were incubated with 1 μM Bafilomycin A1 and 50 μg/ml cycloheximide for 1 h. The cell lysates were subjected to immunoblot analysis using the indicated antibodies. The numbers represent signal intensities normalized to the LC3-II level (first lane). (b) Relative LC3 and Bcl-xL mRNA levels in whole-cell lysates by real-time PCR. (c) Relative LC3 and Bcl-xL mRNA levels in polysomal fractions by real-time PCR. The mRNA levels were normalized to that of β-actin, and relative mRNA quantities divided by those in control cells are shown. *P<0.05, **P<0.01 (Student’s t-test). Data are representative of three independent experiments. (d) Control or RACK1 siRNAs were transfected (20 pmol) into ATG7 knockout MEF cells. Extracts of siRNA-transfected cells were pretreated with pepstatin A (2 ug/ml) for 16 h, and subjected to immunoblot analysis using the indicated antibodies

