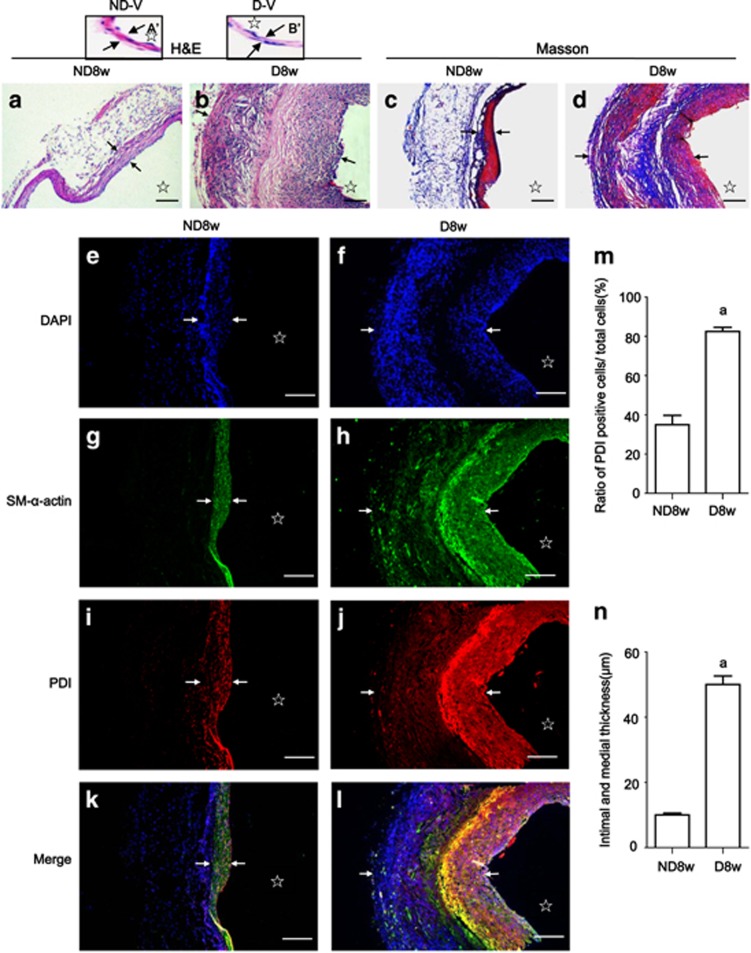
Figure 1.
PDI upregulation in smooth muscle cells leads to accelerated diabetic vein graft arteriosclerosis. Paraffin-embedded sections of the vein grafts of non-diabetic and diabetic mice killed 8 weeks after surgery were used for: (a, b) H&E staining shows the wall structures in vein grafts of non-diabetic and diabetic mice and the respective vena cava (A’, B’) were used for the control of the vein grafts; (c, d) Masson trichromatic staining shows the wall structures and deposited collagenous fibers (blue color) in the vein grafts of non-diabetic and diabetic mice; (e–l) triple-labeling immunofluorescence with primary PDI, SM-alpha-actin antibodies and FITC, or Cy3-conjugated secondary antibody was performed and counterstained with DAPI; (e, f) DAPI staining shows cell nuclei (blue) in the walls of vein grafts from non-diabetic and diabetic mice; (g, h) SM-α-actin positive cells (green) show VSMCs in the vein grafts from non-diabetic and diabetic mice; (i, j) the cells with PDI expression (red) in the vein grafts from non-diabetic and diabetic mice; (k, l) merged images show co-expression (yellow) of PDI (red) and SM-alpha-actin (green) in VSMCs in the walls of vein grafts from (e to j). (m) Statistical results show ratios of PDI-positive cell numbers/ total cell numbers from (e, f and i, j) from three independent experiments; (n) statistical results show wall thickness of vein grafts from (a, b) from third independent experiments. a, P<0.05 versus non-diabetic mice as indicated by analysis of variance (ANOVA) with LSD test. Data are shown as means±SEM. Scale bar, 100 μm. Arrowheads and stars indicate the VSMCs thickness and lumens of the vein grafts, respectively

