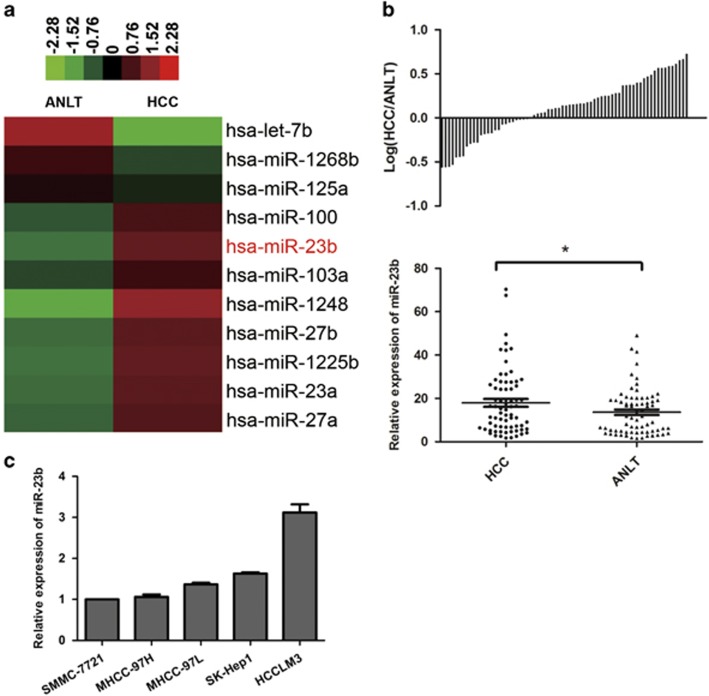
Figure 1.
Expression levels of miR-23b in HCC tissues and cell lines. (a) Partial miRNA expression profiles of HCC tissues and ANLTs. Red or green color in heatmap separately indicates high or low expression according to the color bar in logarithmic scale shown above the heatmap. (b) Expression levels of miR-23b in 70 pairs of HCC tissues and ANLTs were determined by qRT-PCR and normalized to RNU66 expression. Upper panel: the bars represented the relative miR-23b expression with the ratio of its level in HCC tissue versus that in ANLT in logarithmic scale. Lower panel: miR-23b expression levels in HCC tissues and ANLTs were compared with paired Student’s t-test. (c) Relative miR-23b expression levels in HCC cell lines were determined by qRT-PCR. The data were normalized to the expression level of miR-23b in SMMC-7721 cells. Results were represented as mean±S.D. (n=3). *P<0.05

