Figure 4.
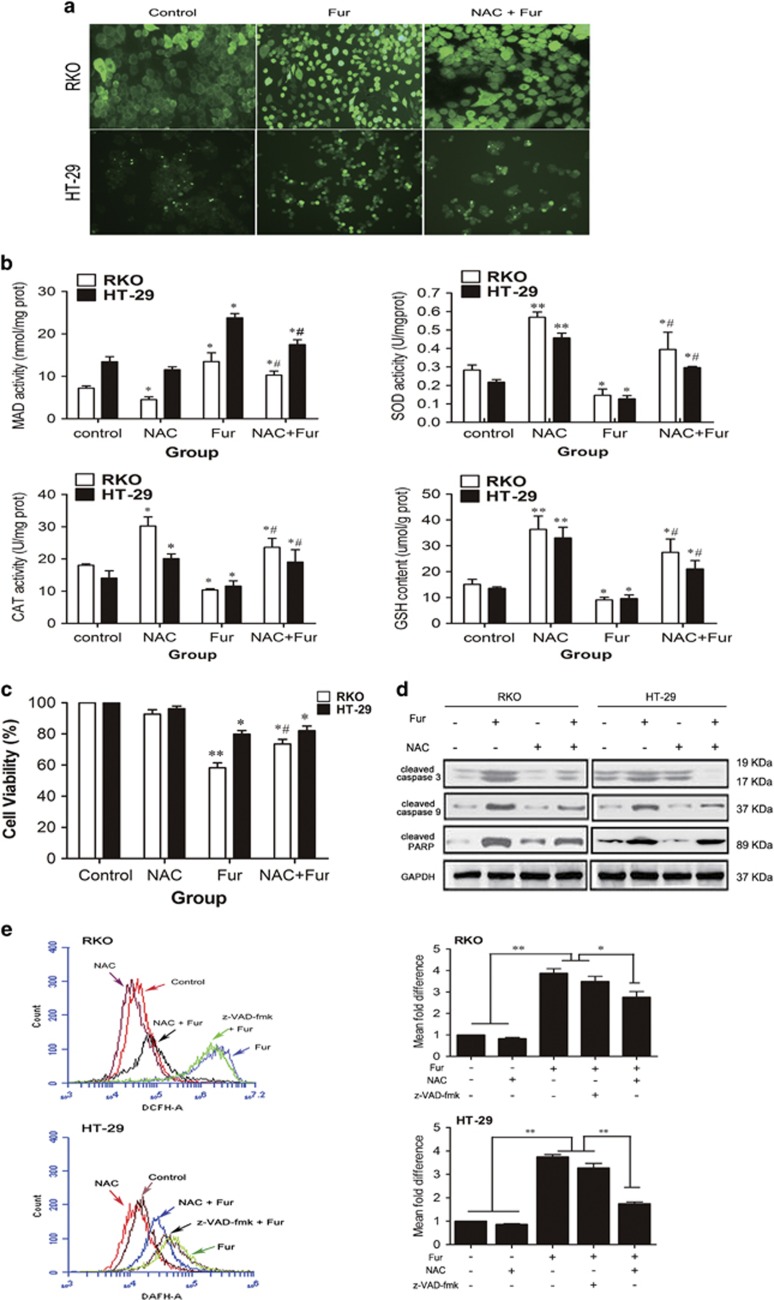
Furanodienone increases ROS production that actions upstream of the mitochondrial pathway. (a) Fluorescence images of cells were observed using DCFH-DA probe at a magnification of × 100. Cells were pretreated with or without 10 mM NAC for 2 h, followed by 150 μM furanodienone exposure for 24 h. (b) Changes of MDA level, SOD and CAT activity, and GSH content at 24 h in furanodienone-treated cells. After exposure to 150 μM furanodienone plus pretreatment with or without 10 mM NAC for 2 h, the production of MDA, activity of SOD and CAT, and GSH content were measured. Date are expressed as mean±S.D. from three independent experiments. (c) Cells were preincubated with 10 mM of NAC for 2 h before treatment with 150 μM of furanodienone for 24 h, and the cell viability was measured by CCK-8 assay. (d) In the absence or presence of NAC, the cleaved caspase-3, -9 and PARP cleavage proteins exposure of 150 μM furanodienone were quantified by western blotting. (e) Total ROS was determined using DCFH-DA probe (10 μM). Cells pretreatment with 10 mM NAC or 100 μM z-VAD-fmk for 2 h were then treated using 150 μM furanodienone for 24 h, and ROS level was measured by flow cytometry. *P<0.05, **P<0.01 versus control, #P<0.05 for Fur versus NAC+Fur

