Figure 1.
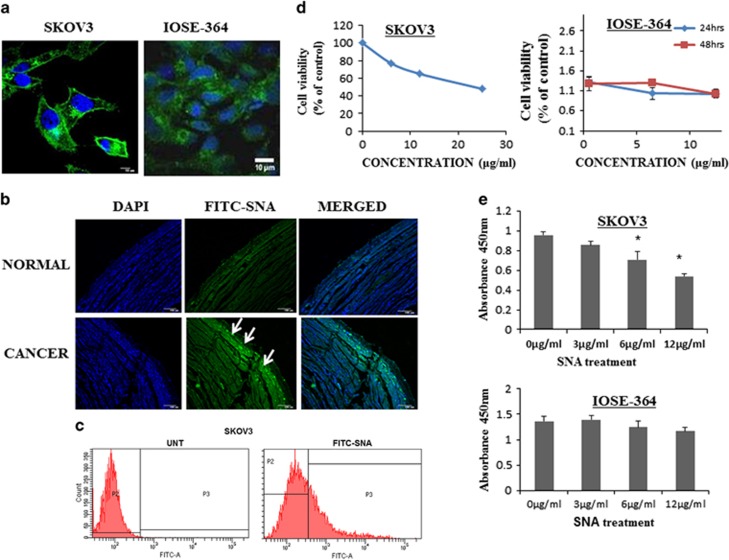
Hyper-sialylation associated with ovarian cancer drives the specificity of SNA. (a) Binding of FITC-SNA to the surface of SKOV3 and IOSE-364 was seen through confocal imaging. Scale bar =10 μm (b) Immunohistochemical analysis showing binding of FITC-SNA (green, shown by arrow marks) to ovarian tissue sections. The nuclei were stained with DAPI. Bar=100 μm. (c) Surface binding of SNA was quantitated by flow cytometry in SKOV3 cells. (d) Quantitation of cellular viability was performed using MTT reagent in SKOV3 and WST-1 reagent in IOSE-364 cell lines. (e) BrdU proliferation assay was performed in SKOV3 and IOSE-364 cell lines with different doses of SNA as indicated

