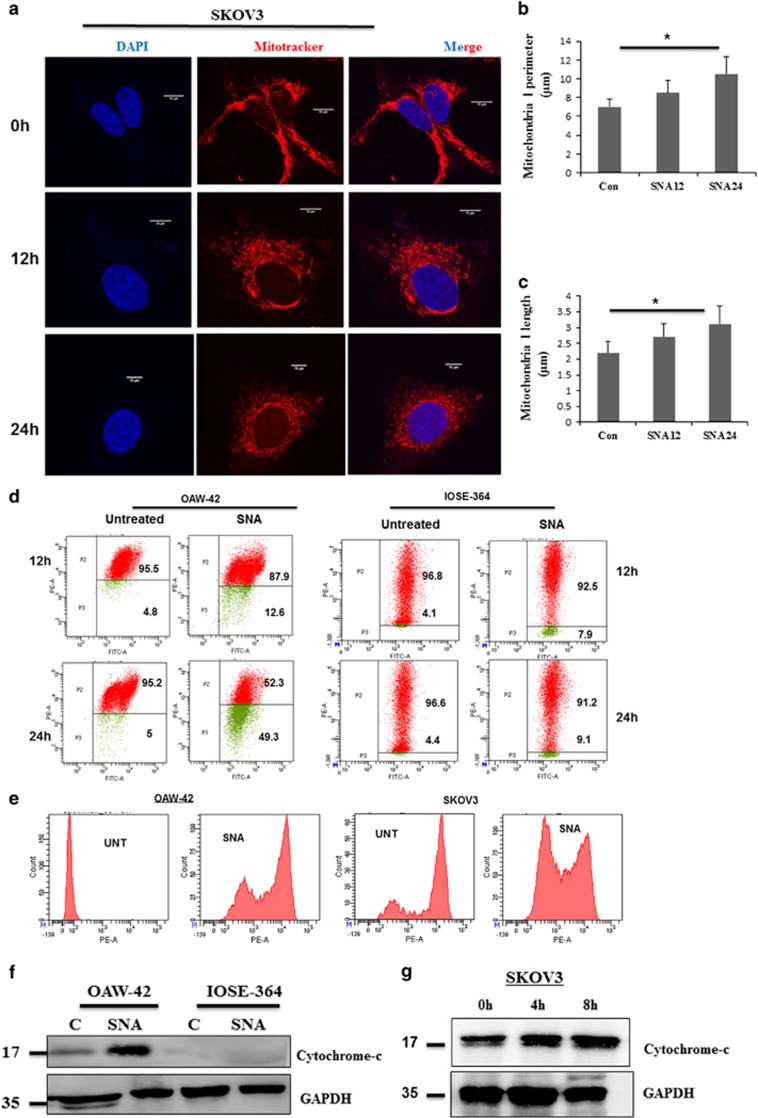
Figure 3.
SNA exposure results in mitochondrial dysfunction. (a) SKOV3 cells stained with MitoTracker Red CMXROS were imaged for mitochondrial structure by confocal microscope. Scale bar represents 10 μm. (b-c) Graphs showing the mitochondrial length and perimeter of SKOV3 cells after indicated time period of SNA exposure. (d) Membrane potential of OAW-42 and IOSE-364 cells stained with JC-1 dye were measured by flow cytometry. (e) ROS production in OAW-42 and SKOV3 cells stained with Mitosox was analyzed by flow cytometry. (f) Western blot depicting cytosolic release of cytochrome-c in OAW-42, IOSE-364 cell lines after 24 h of SNA treatment with GAPDH as loading control. (g) Expression of cytochrome-c after 0, 4 and 8 h of SNA treatment in SKOV3 cells with GAPDH as loading control

