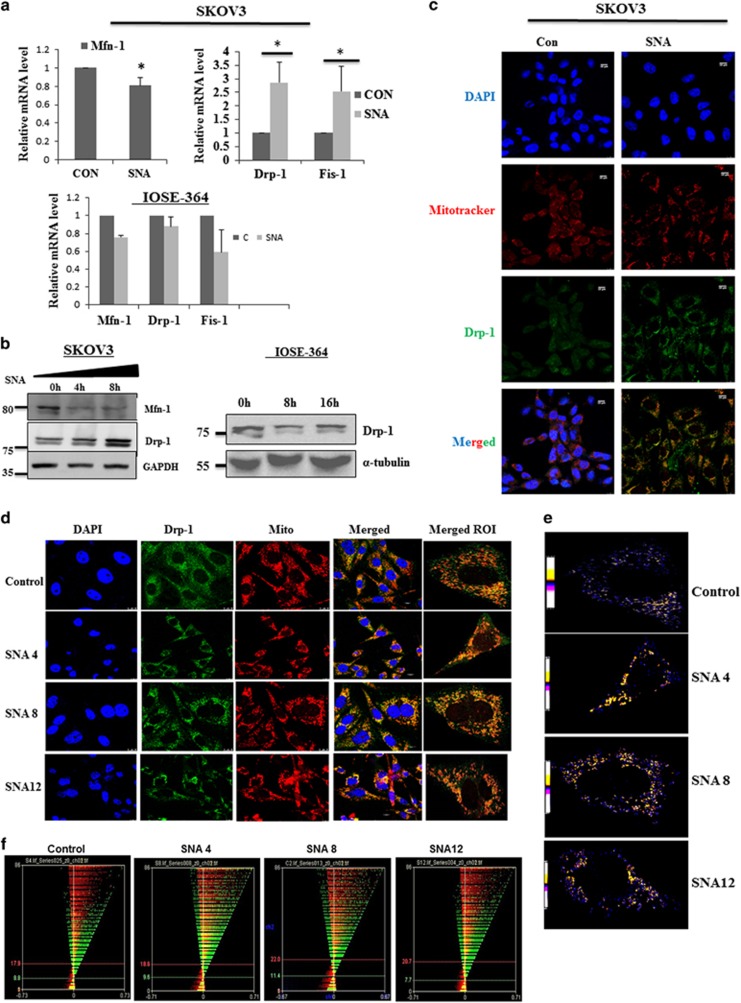
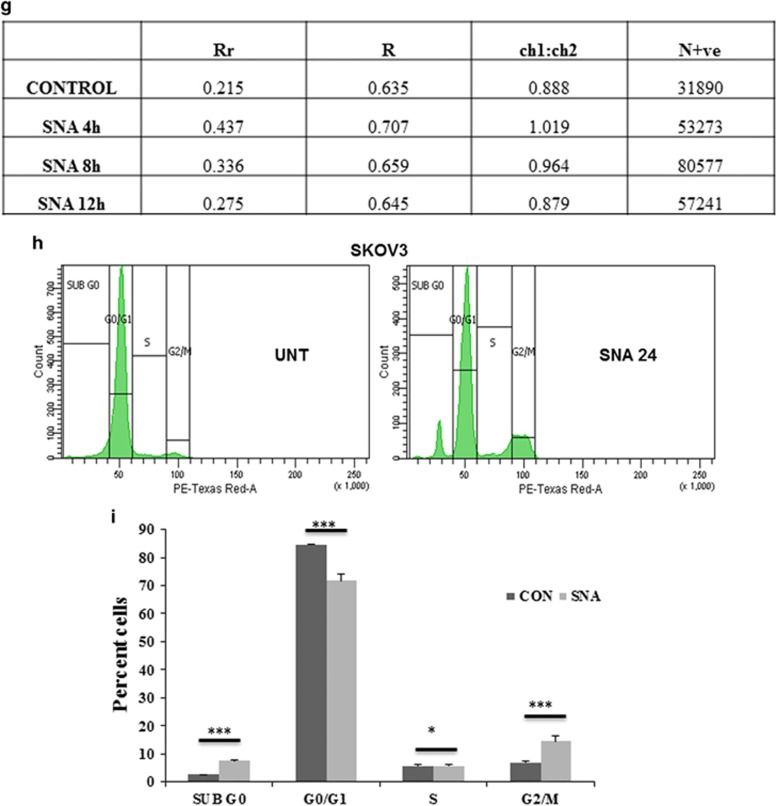
Figure 5.
Mitochondrial fission promoted by mitochondrial translocation of Drp-1 upon SNA exposure, results in decrease of cellular viability. (a) Q-PCR of mitochondrial fission and fusion genes after 4 h of SNA treatment in SKOV3 and IOSE-364 cells. (b) Western blots of Mfn-1 and Drp-1 in SKOV3 cells with GAPDH as loading control and Drp-1 in IOSE-364 cells with tubulin as loading control. (c) Confocal microscopy depicting colocalization of Drp-1(green) with mitochondria (red) in SKOV3 after SNA treatment for 8 h. Nuclei were stained with DAPI. Scale bar=10 μm. (d) Microscopic images of colocalization of Drp-1 (green) with mitochondria (red) in OAW-42 cells treated with SNA for the mentioned time points. ROI indicates merged region of interest. Scale bar=10 μm. (e) Qualitative analysis by PDM imaging. (f) ICA plots generated. (g) Statistics of colocalization study done by ICA. (h) Cell cycle analysis of SKOV3 treated with SNA for longer time periods (24 and 36 h) as observed by flow cytometry. (i) Cells quantitated in each phase of cell-cycle represented as bar diagram


