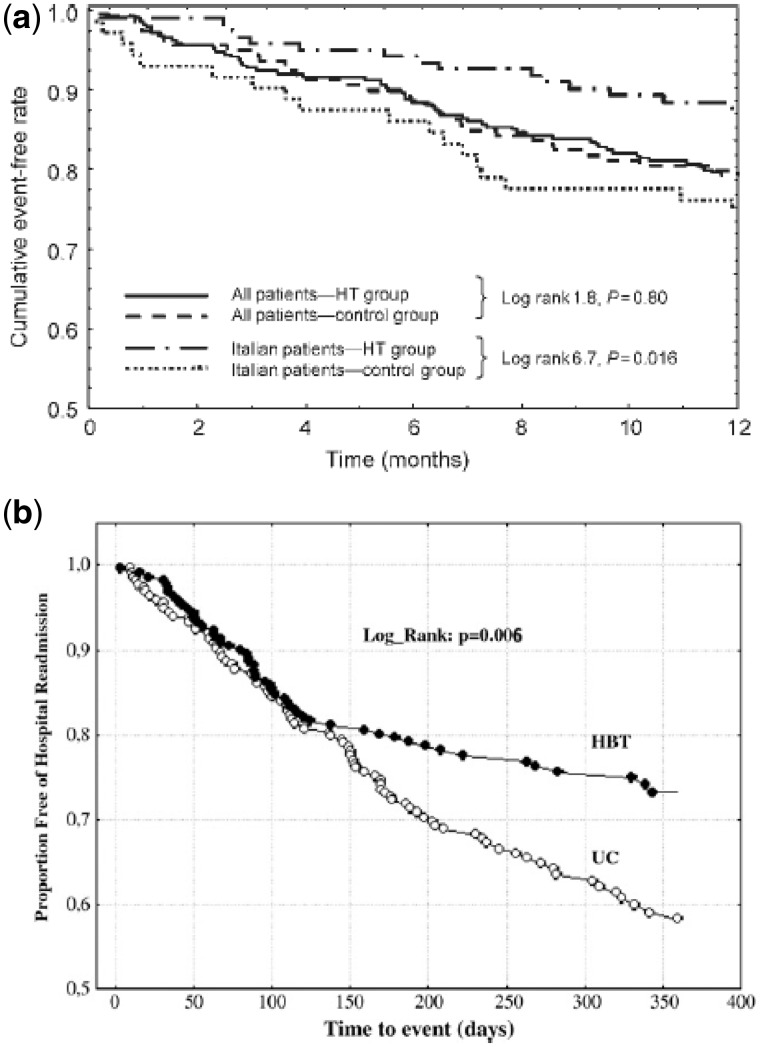
Figure 2.
(A) Kaplan–Meier curves for cumulative events (death + heart failure hospitalization) in the two groups (TLM vs. control group), considering all population and only patients enrolled in Italy.13 Modified from Mortara et al.20 (B) Kaplan–Meier curves for HF hospitalizations in patients randomized to telemonitoring (HBT—home-based telemanagement) in comparison to control group UC=Usual Care. Modified from Giordano et al.22

