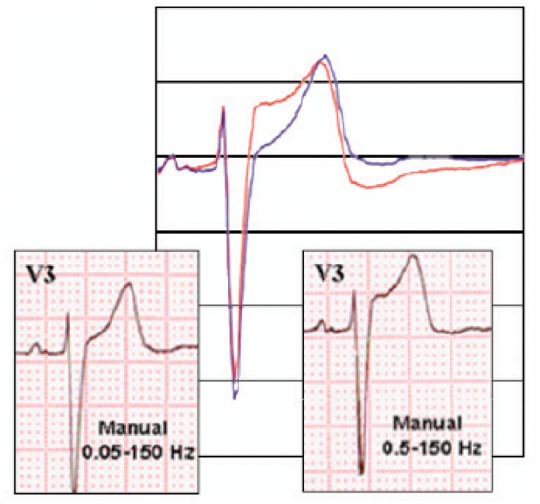
Figure 10.

Effect of a different filtering of the ECG signal. On the left, a bandpass filter between 0.05 and 150 Hz was used, on the right, the filter used was 0.05–150 Hz. Some components of the ST segment appear significantly modified.

Effect of a different filtering of the ECG signal. On the left, a bandpass filter between 0.05 and 150 Hz was used, on the right, the filter used was 0.05–150 Hz. Some components of the ST segment appear significantly modified.