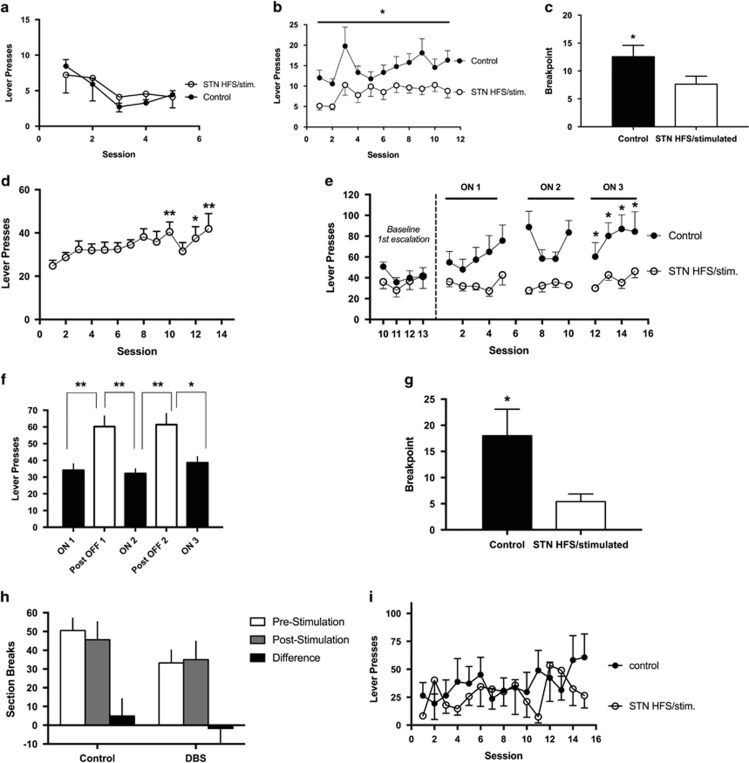
Figure 2.
Heroin self-administration. Heroin self-administration during short-access sessions (Experiment 1) is represented in panels a–c. (a) Training. Number of heroin infusions in 1 h training sessions (no stimulation) between subthalamic nucleus (STN) (black circles) and control animals (white circles). (b) Short access. Number of heroin infusions in 3-h sessions in animals that received high-frequency stimulation (HFS) of the STN (black circles) and control animals (white circles). *p<0.05, significant group effect. (c) Progressive ratio. Breakpoint reached after 3 h session in animals that received HFS in the STN (black bar) and control animals (white bar). *p<0.05, significant difference compared with control group. Heroin self-administration during long-access sessions (Experiment 2) is represented in panels d–g. (d) Initial escalation of heroin self-administration during fourteen 10-h sessions. Heroin self-administration is shown as average lever presses for all animals. *p<0.05, **p<0.01, significant difference compared with first day of long access. (e) Re-escalation during fifteen 10-h sessions in the stimulated (stim.) STN HFS and control groups. Sessions 5 and 10 were followed by a 2-day break from both stimulation and heroin access before the start of the subsequent session. *p<0.05, significant difference compared with control group. (f) Effects on heroin consumption following 2-day breaks from stimulation in the STN HFS group. Phases 1–3 (black bars) show heroin self-administration during stimulation periods. ON-1, average heroin self-administration for sessions 1–5; ON-2, average heroin self-administration for sessions 7–10; ON-3, average heroin self-administration for sessions 12–15. White bars indicate the days of non-stimulation. *p<0.05, **p<0.001, significant differences compared with OFF days. (g) Progressive ratio shown as breakpoints reached after 6 h session in animals in the control group (white bar) and STN HFS group (black bar). *p<0.05, significant difference compared with control group. Motor effects from STN HFS in control and stimulated animals are represented in panels h and i. (h) Animals were assessed for differences in locomotor activity by observing section breaks in their operant boxes before and during stimulation. (i) Lever pressing on the inactive lever during the self-administration sessions were recorded and compared between groups. Error bars indicate SEM. DBS, deep brain stimulation.

