Figure 3.
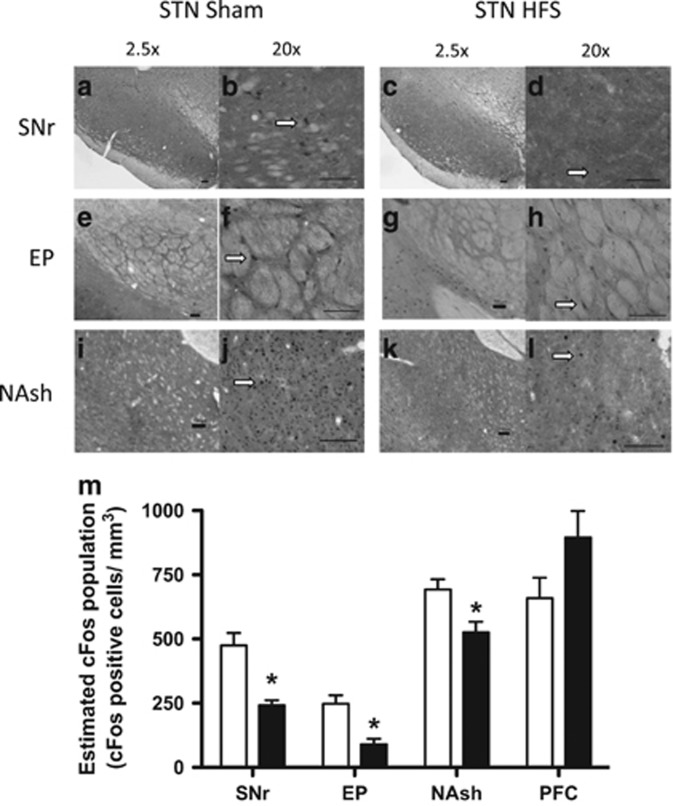
Fos expression in control and stimulated animals. The brain areas that were examined were the substantia nigra pars reticulate (SNr) (a–d), entopeduncular nucleus (EP) (e–h), and nucleus accumbens shell (NAsh) (i–l). Left panels for each structure show images that were taken from control rats, and right panels show images that were taken from stimulated rats. Orientation is noted at 2.5 × magnification (left panels), and cell counts were taken at 20 × magnification (right panels). Arrows highlight a typical Fos-positive neuron for each section. Scale bars=100 μm. (m) The quantification of Fos expression in each structure is illustrated for control rats (empty bars) and subthalamic nucleus high-frequency stimulation (STN HFS) rats (black bars) and was calculated using IPLab 3.9.4 r5 software for Macintosh (Scanalytics) and iVision 4.0.15 software for Macintosh (BioVision). *p<0.05, significant effect compared with control group. Error bars indicate SEM. PFC, prefrontal cortex.

