Figure 2.
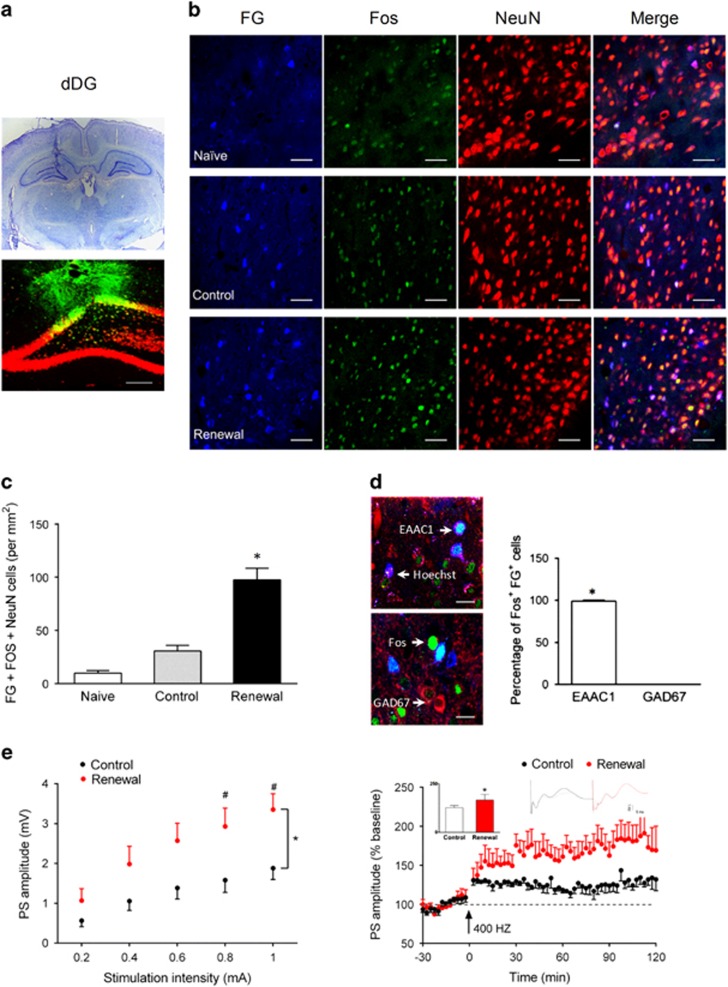
Heroin-paired context exposure induced potentiation of synaptic transmission from the EC to the dDG. (a) FG injection site. Bottom, representative photomicrograph (× 10) of NeuN (red), FG (blue) in the dDG. (b) Representative photomicrographs (× 40) of FG (blue), Fos (green), and NeuN (red) labeling for the EC after exposure to context A, B, or naive rats. Scale bar, 50 μm; n=4 per group. (c) Number of FG-Fos double-positive neurons per mm2 in EC. One-way ANOVA, *P<0.05 vs naive or control group. (d, left) Representative photomicrographs (× 100) of FG (blue), Fos (green)+EAAC1 (red), or GAD67 (red) for the EC of the renewal group. Scale bar, 20 μm; n=4 per group. (d, right) Percentage of Fos+, FG+ cells with EAAC1 and GAD67 in the EC. *P<0.05 vs GAD67 using unpaired t-test. (e) Long-term potentiation induced using 400 Hz tetanic stimulation in vivo. Left, input–output curves. Each point represented the PS amplitude in the dDGub from the five individuals for a given stimulus intensity delivered to the PP. Two-way ANOVA, *P<0.05 vs control group, #P<0.05 vs each stimulation intensity, n=8 per group. Right, high-frequency stimulation at 400 Hz (arrow) induced a reliable LTP. The amplitude of PS was expressed as a percentage of baseline value. Representative traces of PS amplitude are plotted above the curve. *P<0.05 vs control group using unpaired t-test; n=5 per group. Data are depicted as mean±SEM.

