Figure 1.
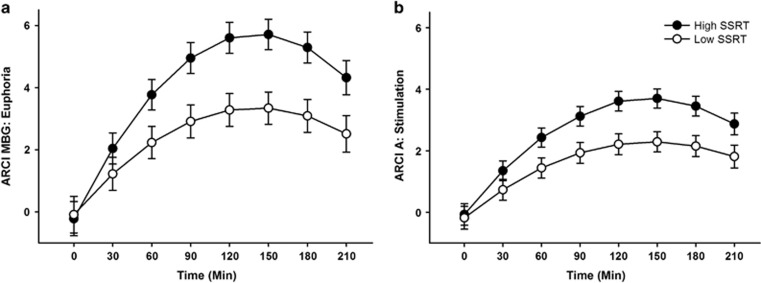
Estimates of drug effects on ARCI MBG (euphoria; a) and ARCI A (stimulation; b) derived from the linear mixed effects models testing associations between SSRT and subjective response to amphetamine (Aim 1). Solid circles represent estimates of drug effects at high levels of SSRT (1 SD above the mean) and open circles represent estimates of drug effects at low levels of SSRT (1 SD below the mean). The inverted U reflects the typical time course of drug response to amphetamine. That is, for both high and low levels of SSRT, magnitude of drug effect increased from baseline to 120 min after drug administration. Effects peaked for about 60 min, and then continued to decline over the session. As hypothesized, poor inhibitory control (high SSRT) was associated with greater magnitude of drug effect across time for both measures. Capped vertical lines represent SEM drug effect.

