Figure 2.
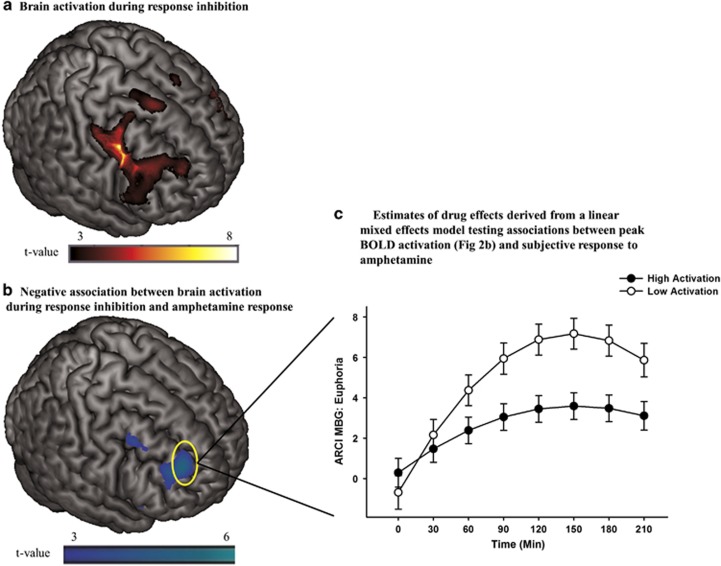
(a) Brain activation during successful response inhibition (StopInh>Go) within the FIS mask. Significant (pFWE<0.05) peak activation was observed in a large right prefrontal cluster encompassing precentral, middle and inferior frontal gyri and anterior insula. Smaller middle and inferior frontal gyri and insular activations were seen in the left hemisphere (Supplementary Table S1). (b) Negative relationship between brain activation during response inhibition (StopInh>Go)] and ARCI MBG peak change difference scores (Aim 2). The negative relationship suggests that less prefrontal activation during inhibition is associated with greater amphetamine-induced euphoria. Peak effect at the [32, 48, 26] MNI coordinate is significant after correcting for family wise error (pFWE<0.05) within a frontal-insular-subcortical (FIS) mask. (c) Estimates of drug effects on ARCI MBG (euphoria) derived from the linear mixed effects model testing associations between brain activation during response inhibition (ie, extracted BOLD signal from a 10 mm radius spherical region centered at the [32, 48, 26] peak in the middle frontal gyrus displayed in 2b) and subjective response to amphetamine (Aim 2). Solid circles represent estimates of drug effects at high levels of activation (1 SD above the mean) and open circles represent estimates of drug effects at low levels of activation (1 SD below the mean). As hypothesized, less frontal activation during response inhibition was associated with greater magnitude of drug effect on ratings of euphoria. Capped vertical lines represent SEM drug effect.

