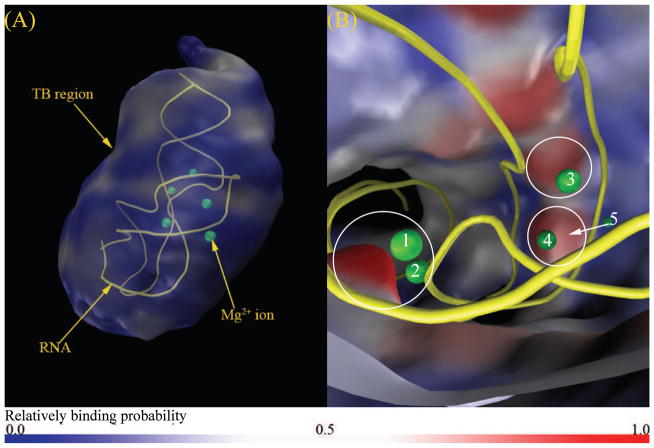
Figure 6.
Predicted TB Mg2+ ion distribution in a solution with 2 mM Mg2+ and 50 mM K+. (a) and (b) show the “zoom-out” and “zoom-in” views of the Mg2+ ion distribution in the TB region, respectively. The labeled spheres are the bound Mg2+ ions shown in the PDB structure (A-riboswitch, PDB ID: 1Y26, yellow color in the figure).

