
Fig. 1.
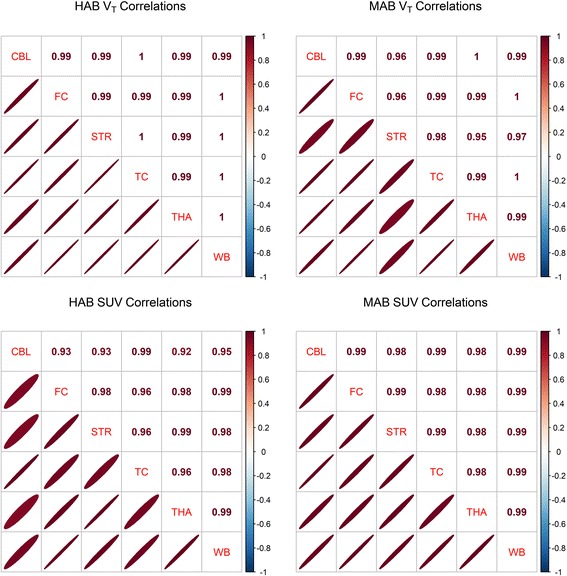
Interregional correlations of [11C]PBR28 VT and SUV. Values represent Pearson’s correlation coefficients. Ellipses designate the magnitude and the direction of the correlation
Official websites use .gov
A
.gov website belongs to an official
government organization in the United States.
Secure .gov websites use HTTPS
A lock (
) or https:// means you've safely
connected to the .gov website. Share sensitive
information only on official, secure websites.
Interregional correlations of [11C]PBR28 VT and SUV. Values represent Pearson’s correlation coefficients. Ellipses designate the magnitude and the direction of the correlation