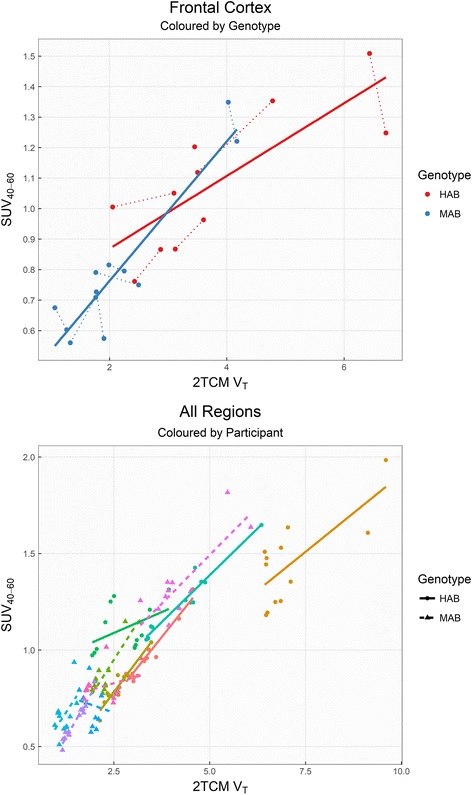
Fig. 2.

[11C]PBR28 VT correlated with SUV, within genotype groups (upper plot, frontal cortex) and within subjects (lower plot, all brain regions). Dotted lines in the upper plot indicate repeated measurements. Solid and dashed lines in the bottom plot represent HABs and MABs respectively
