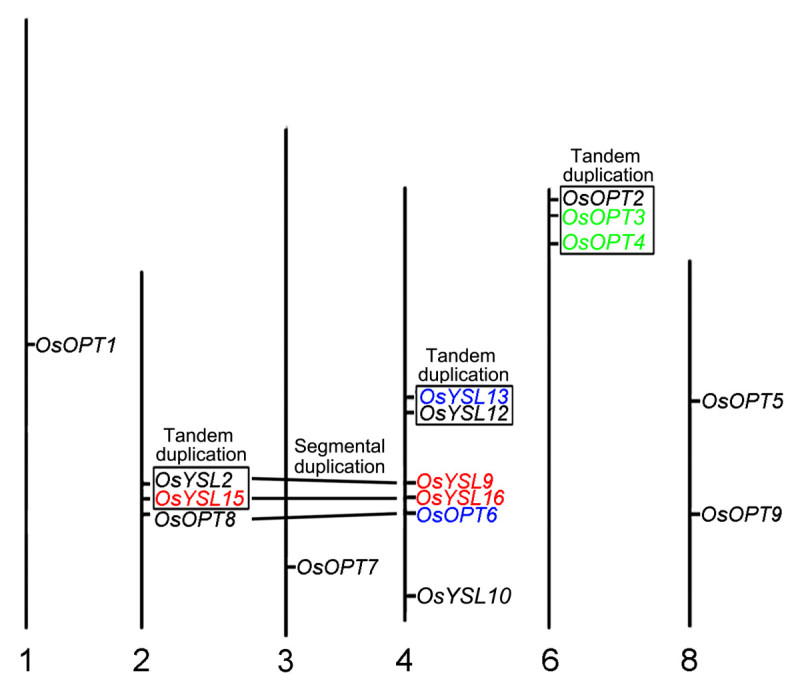
Figure 3.

Chromosomal location, duplication event, and evolutionary stage schematic for OsOPT genes. Chromosome numbers are indicated at the bottom of each bar. The OsOPT genes represented by duplicated chromosomal segments between two chromosomes were connected by lines and the OsOPT genes that resulted from tandem duplication were contained in boxes. The OsOPT genes originating from the first evolutionary stage were shown in red, the OsOPT genes derived from the second evolutionary stage were shown in green, and the OsOPT genes derived from the third evolution stage were shown in blue.
