Figure 1.
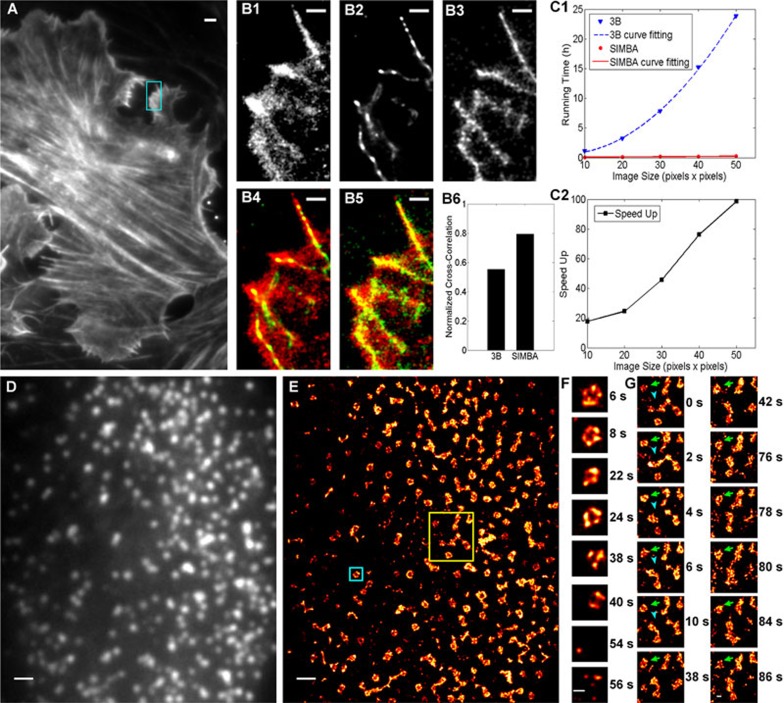
SIMBA imaging of actin network in a fixed U2OS cell and CCPs in a living HeLa cell. (A) Superimposed fluorescence data from the 200 TIRF frames in the SIMBA data set showing the diffraction limit resolution. (B1-3) Reconstruction of the actin ruffles indicated in the cyan box in A using PALM (B1), 3B (B2) and SIMBA (B3). (B4) Overlay of B1 and B2. (B5) Overlay of B1 and B3. (B6) Normalized cross correlation between 3B and PALM is 0.55, between SIMBA and PALM is 0.79. (C1) Computation time for 3B and SIMBA analysis of different image areas (10 × 10 pixels to 50 × 50 pixels). Blue dotted line: 3B; red solid line: SIMBA. (C2) Comparison of the speed of SIMBA and the speed of 3B for different imaging areas. (D) Diffraction limit image of mEos3.2-CLC (clathrin light chain) created by summing the first 100 TIRF frames. (E) The reconstructed SIMBA image of mEos3.2-CLC. (F) Time-lapse images at selective time points of region outlined by the cyan box in E. (G) Time-lapse images at selective time points of region outlined by the yellow box in E. Scale bars are 2 μm (A), 1 μm (D, E), 500 nm (B1-5) and 200 nm (F, G).

