
Figure 10.
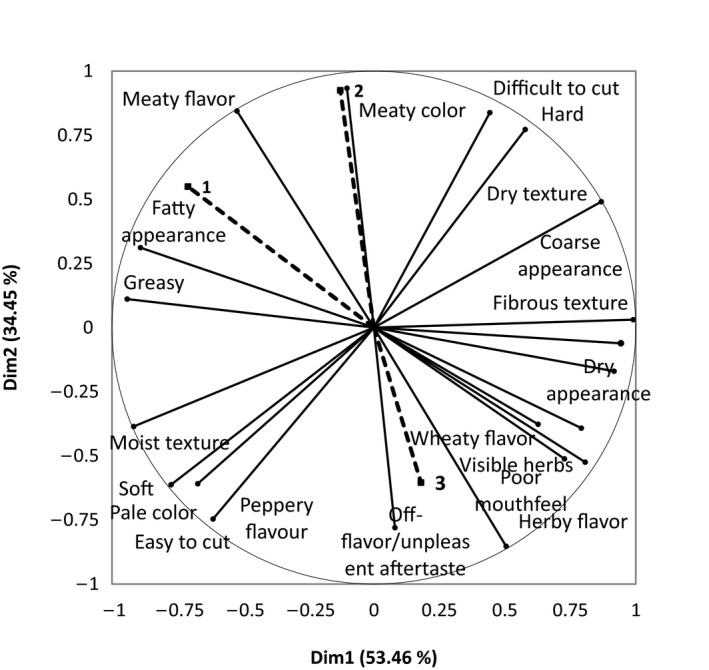
Multiple factor analysis of sensory attributes from CATA questioning and the consumer groups identified from cluster analysis
Official websites use .gov
A
.gov website belongs to an official
government organization in the United States.
Secure .gov websites use HTTPS
A lock (
) or https:// means you've safely
connected to the .gov website. Share sensitive
information only on official, secure websites.
Multiple factor analysis of sensory attributes from CATA questioning and the consumer groups identified from cluster analysis