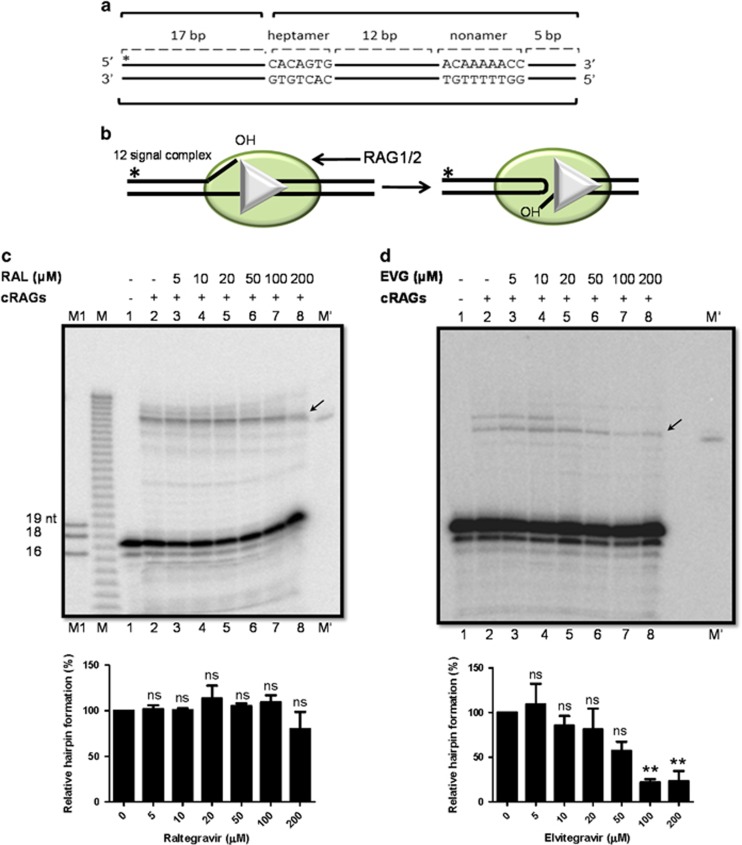
Figure 3.
Effect of integrase inhibitors on hairpin formation during V(D)J recombination. (a) Schematic representation of the pre-nicked oligomeric DNA substrate used in the assay. (b) Schematic representation of RAG-mediated hairpin formation at RSS. (c and d) Gel profile showing the effect of Raltegravir or Elvitegravir on hairpin formation by RAGs. The labelled DNA was incubated with RAGs and increasing concentrations of inhibitors (0, 5, 10, 20, 50, 100 and 200 μM) in a buffer containing 5 mM MnCl2 and the products were separated on a denaturing PAGE. Band due to hairpin formation is indicated by arrows. M represents a single nucleotide DNA ladder, M′ is a hairpin marker and M1 represents a molecular weight marker for 16, 18 and 19 nt. Relative quantifications of the RAG-mediated hairpin formation in the presence of inhibitors are shown below the gels. The data shown are the quantification from three independent batches of experiments

