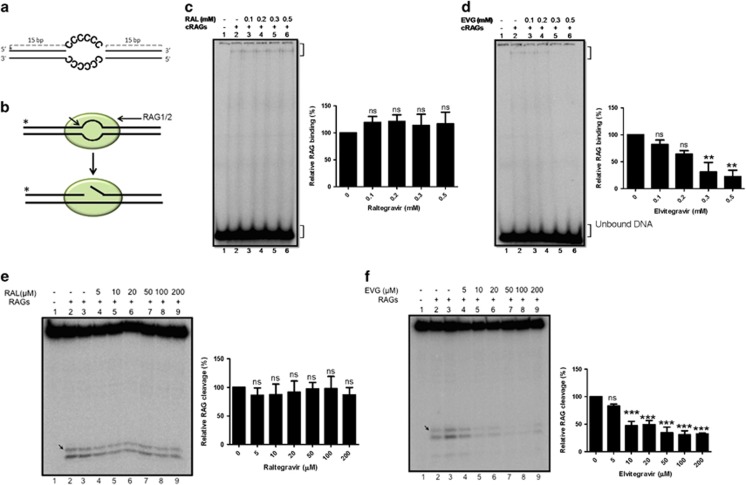
Figure 4.
Effect of integrase inhibitors on structure-specific cleavage activity by RAGs. (a) Schematic representation of the oligomeric DNA substrate containing heteroduplex DNA (C/C)6 used in the assay. The double stranded DNA is shown in bold and the sequence of the region forming the bubble is indicated. (b) Schematic representation of RAG binding and cleavage at heteroduplex DNA. (c and d) Gel profile showing the effect of Raltegravir and Elvitegravir on RAG binding at heteroduplex DNA harbouring 6 nt cytosine bubble. (e and f) Gel profile showing the effect of inhibitors on RAG cleavage at heteroduplex DNA. RAG cleavage position is indicated by arrow. For other details refer figure legend 2. The relative quantifications of the RAG bound or cleaved products (derived from three independent batches of experiments) are shown towards the right in each panel

