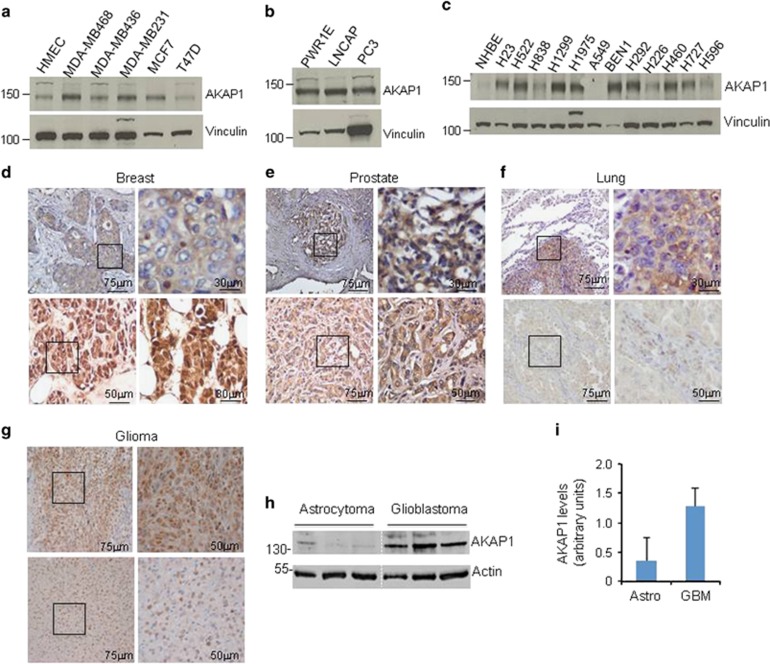
Figure 2.
Expression analysis of AKAP1 in human cancer cells and tissues. (a–c) Immunoblot analysis of AKAP1 in human breast (a), prostate (b) and lung (c) cancer cells. Vinculin was used as a loading control. (d–f) Immunohistochemistry for AKAP1 in breast (d), prostate (e) and lung (f) high-grade (upper panels, IHC score: 2/3) and low-grade (lower panels, IHC score: 0/1) cancer tissues. Size bars are indicated in the panels. (g) IHC on glioblastoma (upper panels, IHC score 3) and astrocytoma (lower panels, IHC score 1) tissues. (h) Immunoblot analysis of AKAP1 in lysates prepared from astrocytoma and glioblastoma human tissues. Actin was used as loading control. (i) Quantitative analysis of the data shown in (h). The data are expressed as mean±S.E.M. of three experiments

