Figure 1.
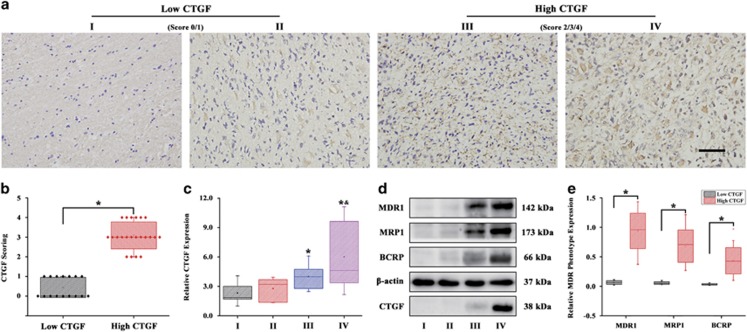
CTGF expression associates with GB grades and chemoresistance. The immunohistochemical staining of CTGF expression in GB tissues with different tumor grades (a) and the CTGF scoring analysis (b), I (n=7); II (n=9); III (n=6); IV (n=16), brown staining indicated the positive immunoreactivity, the tumor grade I and II with low CTGF staining was set as the low CTGF group (score 0/1), while grade III and IV with positive CTGF staining was set as the high CTGF group (score 2/3/4), scale bar=100 μm, *P<0.05. The qPCR analysis of CTGF expression in GB tissues with different tumor grades (c), *P<0.05 compared to the GB grade I; &P<0.05 compared to the GB grade II. Protein expression of multidrug resistance phenotype (MDR1, MRP1, BCRP1) and CTGF in different tumor grades of GB by western blot analysis (d) and further protein band density quantification analysis (e); β-actin served as the loading control, *P<0.05. Results above are expressed as the mean±S.D. of three independent experiments

