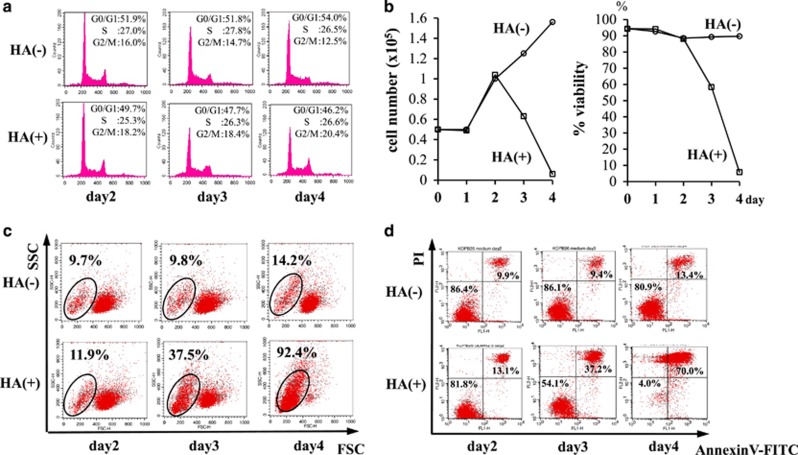
Figure 3.
Analysis of cell death after ULMW-HA stimulation. (a) Cell cycle analysis. KOPB26 cells (0.5 × 10⁵ per well) were cultured in the presence or absence of ULMW-HA (2.5 mg/ml) for up to 4 days, and cell cycle analysis was performed by the PI staining at days 2, 3 and 4. (b) Changes in cell number and viability. KOPB26 cells (0.5 × 10⁵ per well) were cultured in the presence or absence of ULMW-HA (2.5 mg/ml) up to 4 days, and changes in cell number (left panel) and viability (right panel) were examined in duplicate by the dye exclusion test at days 1, 2, 3 and 4. The results are representative from three separate experiments and are shown as the mean. (c) Flow cytometric analysis on scatter cytograms. KOPB26 cells (0.5 × 10⁵ per well) were cultured in the presence or absence of ULMW-HA (2.5 mg/ml) for up to 4 days, and cytograms (FSC versus SSC) were examined at days 2, 3 and 4. (d) Flow cytometric analysis of cell death using annexin V/PI staining. KOPB26 cells (0.5 × 10⁵ per well) were cultured in the presence or absence of ULMW-HA (2.5 mg/ml) for up to 4 days, and flow cytometric analysis of cell death was performed by annexin V/PI staining at days 2, 3 and 4

