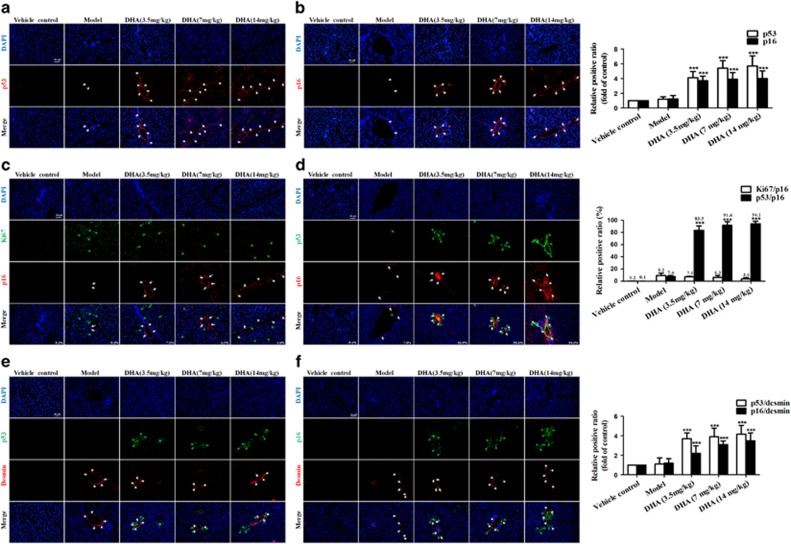
Figure 1.
DHA induces the accumulation of senescent activated HSCs in rat fibrotic liver. Rats were grouped as follows: group 1, vehicle control (no CCl4, no treatment); group 2, model group (with CCl4, no treatment); group 3, DHA (3.5 mg/kg) and CCl4-treated group; group 4, DHA (7 mg/kg) and CCl4-treated group; group 5, DHA (14mg/kg) and CCl4-treated group. (a and b) Liver sections were stained with immunofluorescence by using antibodies against p53 and p16. White arrows indicated p53 and p16-positive cells. (c) Liver sections were co-stained with p16 and Ki67. White arrows indicated p16-positive cells, while green arrows indicated Ki67-positive cells. (d) Liver sections were co-stained with p16 and p53. White arrows indicated p16-positive cells, while green arrows indicated p53-positive cells. (e) Liver sections were co-stained with desmin and p53. White arrows indicated desmin positive cells, while green arrows indicated p53-positive cells. (f) Liver sections were co-stained with desmin and p16. White arrows indicated desmin positive cells, while green arrows indicated p16-positive cells. For the statistics of each panel in this figure, data are expressed as mean±S.D. (n=6). Scale bars are 50 μm. For the statistics of each panel in this figure, data are expressed as mean±S.D. (n=6); *P<0.05 versus control, **P<0.01 versus control, ***P<0.001 versus control

