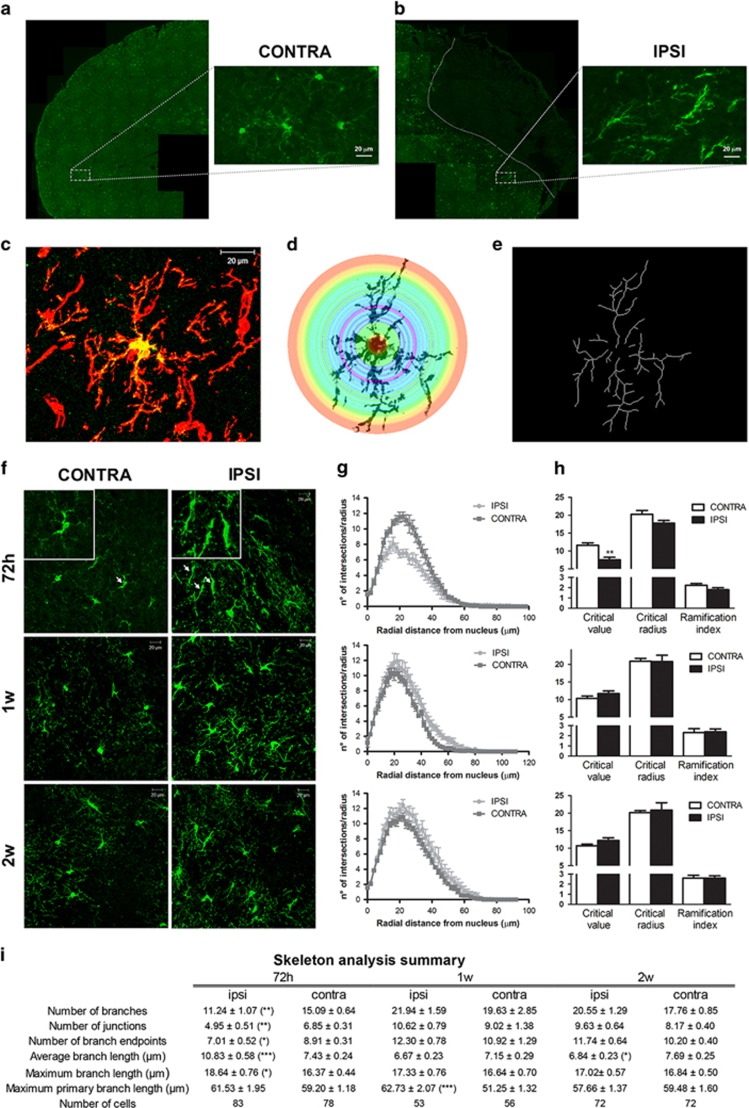
Figure 3.
GFP+ cells undergo morphological changes in response to brain ischemia. (a and b) Representative images of GFP immunofluorescence of contralateral (a) and ipsilateral (b) hemispheres from GPR17iCreERT2:CAG-eGFP mice 72 h after MCAo. Insets show higher magnification of representative non polarized GFP+ cells with cell processes extending in all directions (contralateral side, a) or highly ‘polarized’ GFP+ cells showing a bipolar shape, with processes aligned with the cell body and extended toward the ischemic area (ipsilateral ischemic side in b; dotted line indicates the borders of the ischemic core). (c) Representative images of a GFP+ (green) and NG2+ (red) selected for the morphological analysis. Scale bar=20 μm. (d) Illustration of Sholl analysis used to quantify process branching. The number of intersections made by the extending processes with each circle was automatic counted and used as a measure of process branching. (e) Illustration of skeletonized cells; Skeleton analysis was used to get information on the cell morphology complexity. (f) Representative images of GFP+ cells (green) and HOECHST 33258 (blue) in contralateral and ipsilateral dorsal cortex at 72 h, 1 week and 2 weeks after MCAo. High magnification of images at 72 h is reported. Scale bar=20 μm. (g) Sholl analysis plot of GFP+ cells and (h) bar graphs of Critical value, Critical radius and Ramification index at 72 h, 1 week and 2 weeks after MCAo. (i) Skeleton analysis data summary. *P<0.05; **P<0.01; ***P<0.001; Student’s t-test

