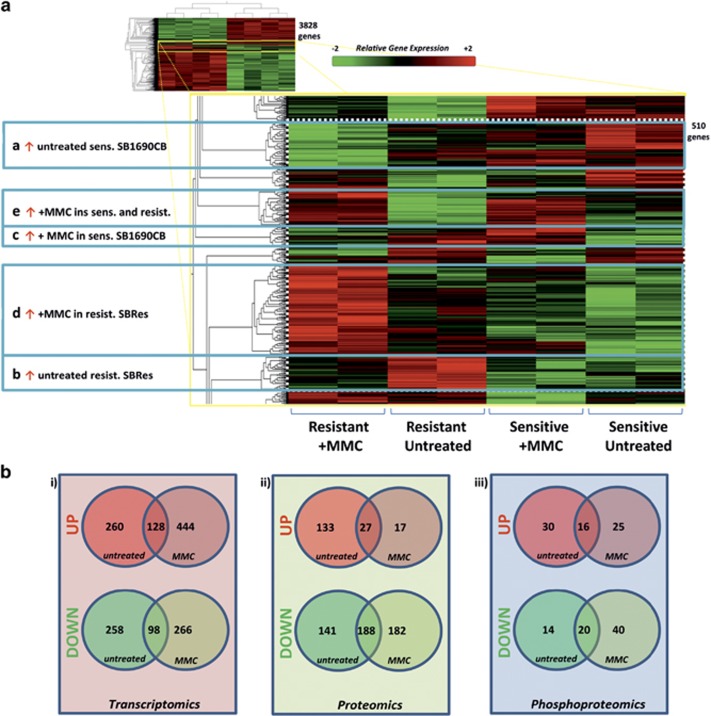
Figure 6.
Expression phenotype of acquired MMC resistance. (a) Heat map illustration of differential gene expression between MMC-resistant and MMC-sensitive cells with and without MMC treatment (2MMol). 3828 differentially expressed genes (group ANOVA P<0.05) were identified. Clustering of the data within the heat map delineated distinct groups of gene expression patterns differentiating the MMC-resistant and sensitive states as indicated (total of 510 genes). Corresponding lists are provided in Supplementary Tables. (b) Numerical Venn diagram illustration of transcriptomic analysis (left, P<0.01), proteomic (middle) and phosphoproteomic (right) analysis comparing sensitive and resistant cell lines with and without MMC split into up and downregulated transcripts/proteins/phosphopeptides. Corresponding lists are provided in Supplementary Material

