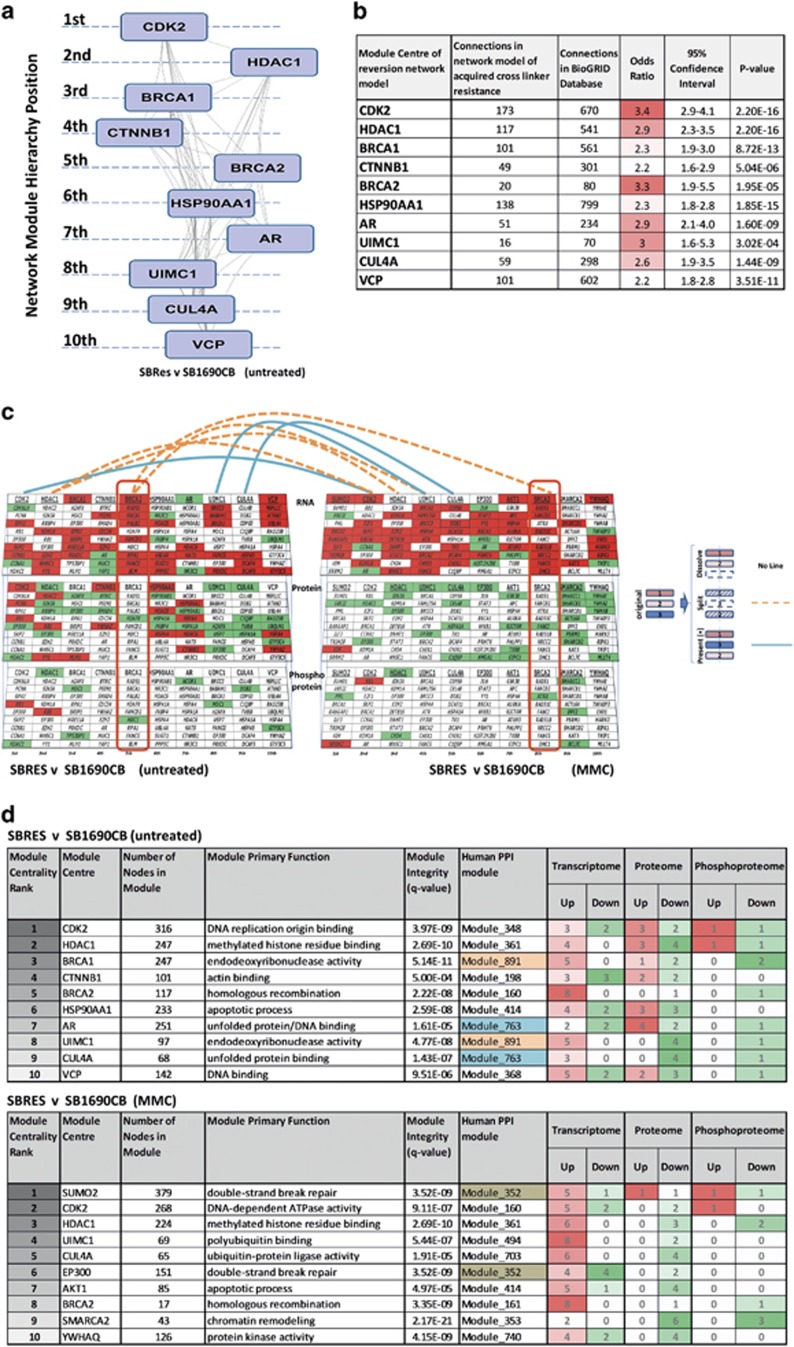
Figure 7.
Integrated analysis defining differences between resistant and sensitive cells untreated and in response to Mitomycin C (MMC). (a) Network modules delineated by inferred interactions from integrated analysis of transcriptional, proteomic and phosphoproteomic differences between untreated sensitive and resistant cells. The network modules were delineated and ranked by network centrality applying the Moduland community clustering approach. (b) Quantitative characterization of network modules delineated from integrated analysis of acquired cross-linker resistance, by defining differences in observed connectivity in relation to the expected connectivity in the human interactome (BioGRID). Odds ratio, 95% confidence intervals and p-values generated using Fisher’s exact test. (c) Network dimensions and changes in response to MMC. Changes affecting the three dimensions of the integrated data (transcriptome, upper level; proteome, middle level; phosphoproteome, lower level) of untreated cells (left panel) were mapped to the central units of each network module in hierarchical order; downregulated transcription and decreased protein expression/phosphorylation in green; up-regulated transcription, higher levels of protein expression and presence of phosphorylation in red. Cartoon besides panels: In response to environmental changes modules can remain, but the position in the hierarchy can change, split into new clusters or dissolve. The effects on the network of MMC treatment are illustrated (right panel), with delineation of novel clusters dominated by SUMO, AKT1, EP300, YWHAC and SMARCA2, splitting and resoling clusters as indicated. (d) Statistical and ontological characterization of clusters and dominating network modules for untreated cells (upper panel) and in response to MMC (lower panel)

