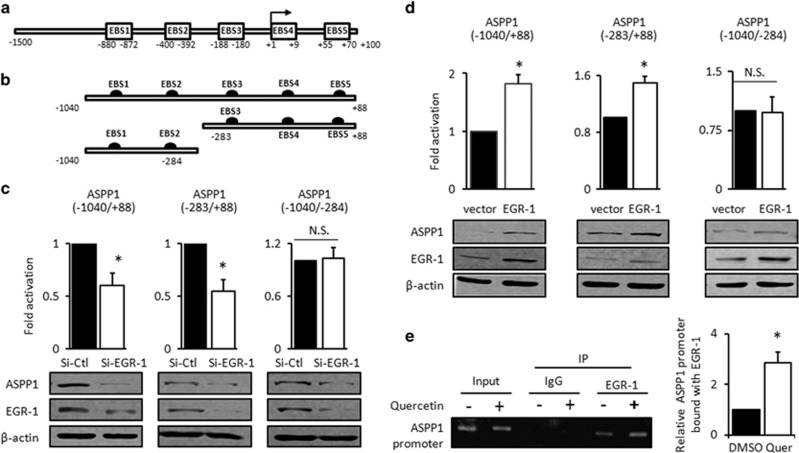
Figure 3.
ASPP1 is a transcriptional target of EGR-1 (a) ASPP1 promoter region (−1500/+100) contained five consensus EGR-1 binding sites (EBS, EGR-1 binding sites), as predicted by PROMO v3 (http://alggen.lsi.upc.es/cgi-bin/promo_v3/promo/promoinit.cgi?dirDB=TF_8.3) software and shown in rectangle. (b) Schematic representation of (−1040/+88) ASPP1 promoter and two mutants, (−1040/−283), containing EBS1-2, or (−1040/−283), containing EBS3-5, were cloned into the luciferase reporter plasmid. (c and d) Luciferase assay was conducted in with either EGR-1 knockdown (c) or EGR-1 overexpression, as described in the 'Materials and Methods' section. Bar graph presented change folds in activation over controls, derived from three independent experiments. S.D. were shown as error bars. (e) Cells in the presence or absence of Quercetin were subjected to the ChIP assay. IgG was used as a negative control. The bands were quantified by ImageJ, and normalized with corresponding input. The quantification results derived from three independent experiments were shown in bar graph; *P<0.05

