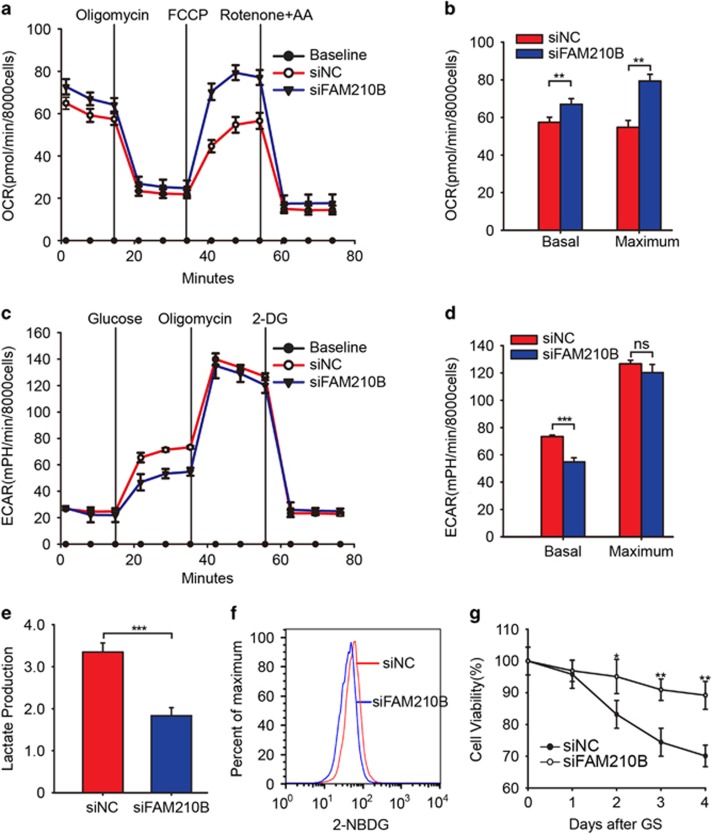
Figure 5.
Loss of FAM210B mediates metabolic reprogramming in cancer cells. (a) Normalized OCR in siFAM210B (n=8) and negative control SKOV3 cells (n=8 wells). (b) Scale bar of basal OCR and maximum OCR in siFAM210B (n=8) and negative control SKOV3 cells (n=8 wells). (c) Relative ECARs normalized to the cell number over time in siFAM210B (n=8) and negative control SKOV3 cells (n=8 wells). (d) Scale bar of basal ECAR and maximum ECAR in siFAM210B (n=8) and negative control SKOV3 cells (n=8 wells). (e) Lactate production normalized to total cell protein in siFAM210B (n=3) and negative control SKOV3 cells (n=3). (f) Flow cytometry of 2-NBDG stain in siFAM210B and negative control SKOV3 cells. A total of 8000 cells was analyzed. (g) Cell viability rate normalized to day 1 in siFAM210B and negative control SKOV3 cells. Data were represented as the means±S.E.M. Statistics were compared using unpaired Student’s t-test; NS: not significant. *P<0.05, **P<0.01, ***P<0.001, ****P<0.0001

