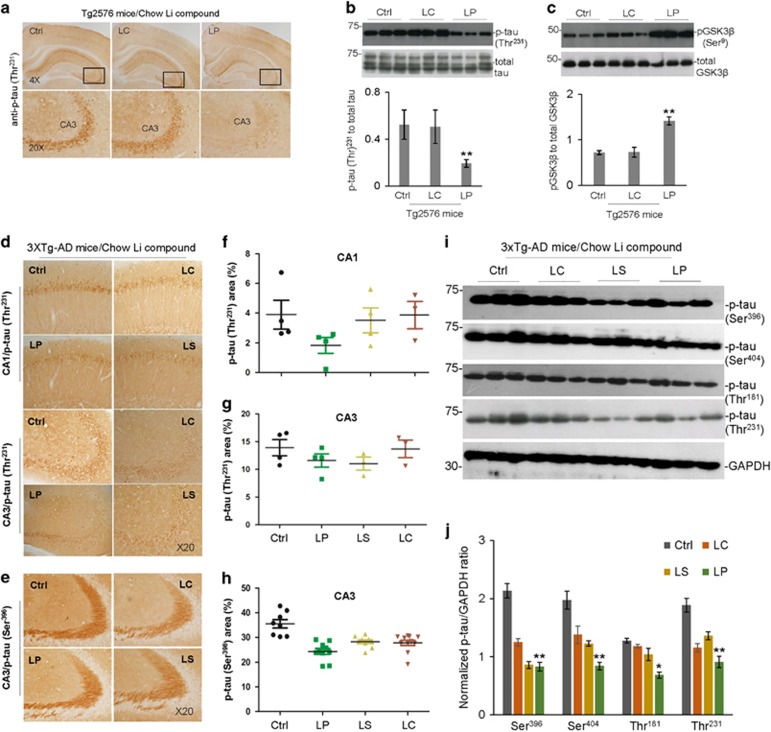
Figure 4.
Oral LP treatment reduces tau hyper-phosphorylation in Tg2576 and 3XTg-AD mice - Representative micrographs showing IHC staining of brain sections from Tg2576 and 3XTg-AD mice orally treated for 8 and 28 weeks, respectively, with diets containing LP, LS, or LC, yielding lithium at 2.25 mM/kg/day, or control Teklad 2018 diet, as detailed in Figure 3 above. Shown are IHC staining and quantification of p-tau (Thr231, a, d) and p-tau (Ser396, e) immunoreactivity in CA3 of Tg2576 (a) and CA1/CA3 of 3XTg-AD mice brain sections (d, e). Percentage of p-tau (Thr231) or p-tau (Ser396) positive areas (mean±S.E.M.) was quantified by image analysis in CA1/CA3 of 3XTg-AD mice (f–h). ANOVA with post hoc analyses using Fisher’s LSD test for multiple samples reveals significant differences in phosphorylated tau between LP-treated and control mice (*P<0.05, **P<0.01). The mouse brain homogenates were subjected to western blot (WB) analysis with antibodies against p-tau (Thr231), p-tau (Ser396), p-tau (Ser404), p-tau (Thr181), total tau, GAPDH (b,i), pGSK3β (Ser9), or total GSK3β (c). As shown below WB, densitometry analysis shows the band density ratios of p-tau to total tau (b, bottom panel) or GAPDH (j) and pGSK3β to total GSK3β (c, bottom panel). Statistical t-test analyses of WB data revealed a significant decrease in the ratios of p-tau (Thr231) to total tau (b) and increase in pGSK3β (Ser9) to total GSK3β (c) in LP compared with LC-treated Tg2576 mice (**P<0.01). One-way ANOVA and post hoc analyses revealed significant differences in the ratio of p-tau to GAPDH (j) compared with control treatment (Ctrl, *P<0.05, **P<0.01). Similar results from both immunochemistry staining and WB analyses were also obtained with PHF1 antibody (data not shown) in the LISPRO-treated Tg2576 mice. There was no notable and significant difference in both p-tau (Thr231) and inactivated pGSK3β (Ser9) levels in brain homogenates between LC- and control Teklad 2018 diet-fed Tg2576 mice (P>0.05)

