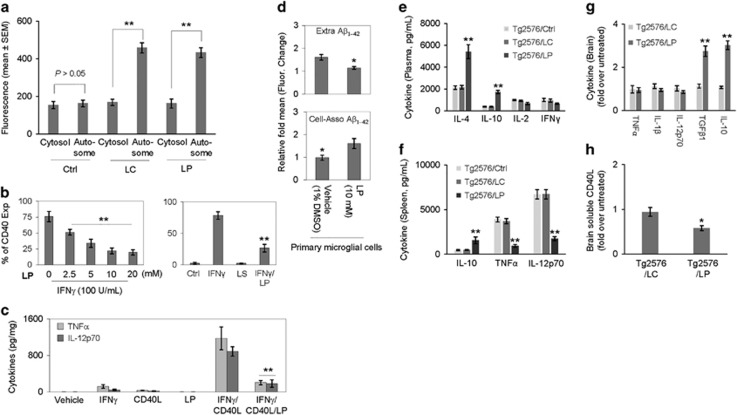
Figure 5.
LP inhibits peripheral and neuroinflammation, while promoting microglial autophagy and Aβ phagocytosis. (a) For determination of microglial autophagy, mouse primary microglial cells were pre-treated with LP, LC, LiCl, or L-proline at 10 mM or PBS (Ctrl) for 18 h, followed by permeabilization, staining with LC3B rabbit polyclonal antibody, and visualization with Alexa Fluor 647 goat anti-rabbit IgG (LC3B antibody kit, Molecular Probes). The fluorescence intensity of the autophagosomes (Autosome) and the cytosol were quantified using Slidebook digital microscopy software (mean±S.D.). Both LP and LC treatments significantly enhanced microglial autophagy (**P<0.01). Note that there was no significance difference in the fluorescence intensity of the autophagosomes and the cytosol between LC, LP, and LiCl (P>0.05). L-proline failed to promote any notable autophagy. In addition, mouse primary microglial cells were treated with LP (0–20 mM) in the presence of IFNγ (100 U/ml) or/and CD40 ligand (CD40L, 1 μg/ml) for 8 h and then examined for pro-inflammatory microglial activation as assessed by flow cytometric (FACS) analysis and ELISA. (b) FACS analysis showed LP induced significant dose-dependent decreases in IFNγ-induced CD40 expression. Data are represented as mean percentage of CD40 expressing (CD40 Exp) cells (±S.E.M.) from two independent experiments. (c) Microglial cell culture supernatants were collected and subjected to cytokine ELISA as indicated. Data are represented as mean pg of TNFα or IL-12p70 per mg of total cellular protein (±S.E.M.) from three independent experiments. For determination of microglial Aβ phagocytosis, primary microglial cell were pre-treated with LP at 10 mM or vehicle (1% DMSO in medium) for 6 h and then incubated with 1 μM FITC-Aβ1–42 for 1 h (d). Cellular supernatants and lysates were analyzed for extracellular (Extra, top panel) and cell-associated (Cell-Asso, bottom panel) FITC-Aβ1–42 using a fluorometer. Data are represented as the relative fold of mean fluorescence change (mean±S.E.M.), calculated as the mean fluorescence for each sample at 37 °C divided by mean fluorescence at 4 °C (n=4 for each condition presented) (**P<0.01). LDH assay showed no significant increase in cell toxicity induced by LISPRO up to 20 mM in primary microglial cells (data not shown). For determination of peripheral and neuroinflammation, blood plasma (e), splenocyte cultured media (f) and brain homogenates (g, h) from LP- and LC-treated and untreated Tg2576 mice (Ctrl) were subjected to cytokine and sCD40L ELISA. Data are presented as mean±S.E.M. values of cytokines (pg/ml plasma or medium) (e, f) or fold increase of brain tissue-derived cytokines or sCD40L for LC or LP-treated over untreated mice (g,h), n=9 for LP- and LC-treated mice; n=6 mice for untreated mice, (*P<0.05; **P<0.01). There was no notable or significant difference in cytokine levels in plasma and splenocyte cultured media between LC-treated and control untreated mice (P>0.05)

