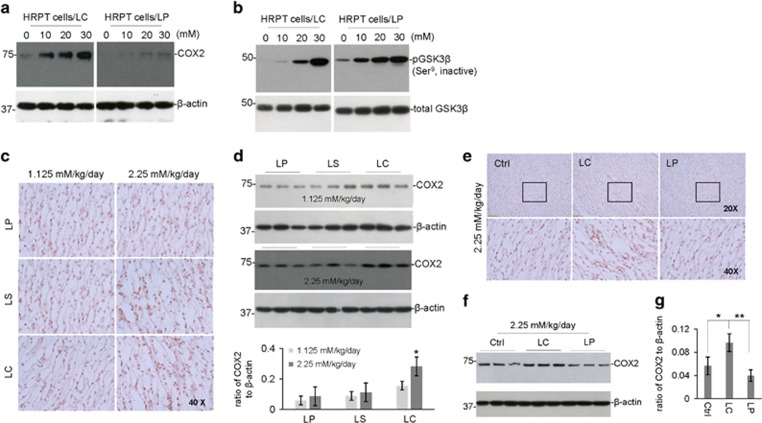
Figure 8.
LISPRO does not increase COX2 expression in vitro and in vivo - Human primary renal proximal tubule cells (ATCC PCS-400-010) were cultured in InVitroGRO medium (BioreclamationIVT) and treated with LP, LC, LiCl, or L-proline at 0 to 30 mM for 12 h. These cells were then lysed with cell lysis buffer and analyzed by WB for COX2, total GSK3β and phospho GSK3β (Ser9 and Thr390) expression using anti-COX2 antibody (a) and anti-phospho- and total GSK3β antibodies (b). Note that there were no notable differences in COX2 expression or GSK3β phosphorylation between LC and LiCl treatments. L-proline treatment induced no change in COX2 expression and GSK3β phosphorylation. B6129F2/J male mice (weighing 20–25 g, 2-month old) were treated with 3 diets containing LP, LC, or LS, or control Teklad 2018 diet, for 1 or 2 weeks, yielding lithium at 1.125 or 2.25 mM/kg/day. All mice received normal drinking water and chow ad libitum. (c) Kidneys were collected after treatment and analyzed by IHC for COX2 expression in the renal medulla. (d) In addition, the kidney microsomal proteins were extracted to assess COX2 expression by WB analysis. COX2 to β-actin band density ratio of WB were determined by ImageJ analysis (mean±S.E.M.) in duplicates from six mice in each group. Statistical analysis was carried out using ANOVA (*P<0.05, n=6 for LP, LC and, LS; n=3 for control diet). Furthermore, Tg2576 mice were treated with two diets containing LP or LP, yielding lithium at 2.25 mM/kg/day for 8 weeks. (e) Kidneys were collected after treatment and analyzed by IHC for COX2 expression in the renal medulla. (f) The kidney microsomal proteins were extracted to assess COX2 expression by WB. (g) Quantification of COX2 to β- actin band density ratio of WB among ctrl, LP, and LC treatments were determined by ImageJ analysis. Statistical analysis was carried out using ANOVA followed post hoc by Fishers LSD (*P<0.05, **P<0.01, n=9 per treatment)

