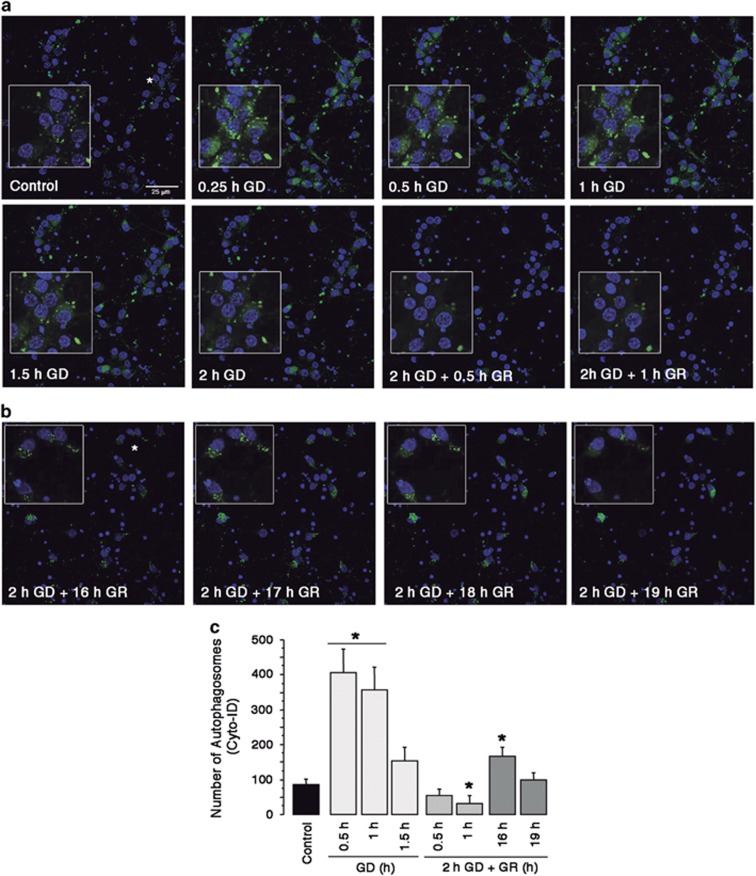
Figure 2.
Autophagosomes are formed in cortical cultures during GD and late GR. Representative images of time-lapse autophagosome formation in cortical cultures exposed to GD/GR using the Cyto-ID detection kit (green) and Hoechst counterstaining (blue) (a and b). Asterisks indicate magnification zones. Graph shows the number of autophagosomes at different times after GD/GR (c). Bars represent mean±S.E.M. (n=3–6). Data were analyzed by one-way ANOVA followed by a Fisher’s post hoc test *P<0.05 versus control

