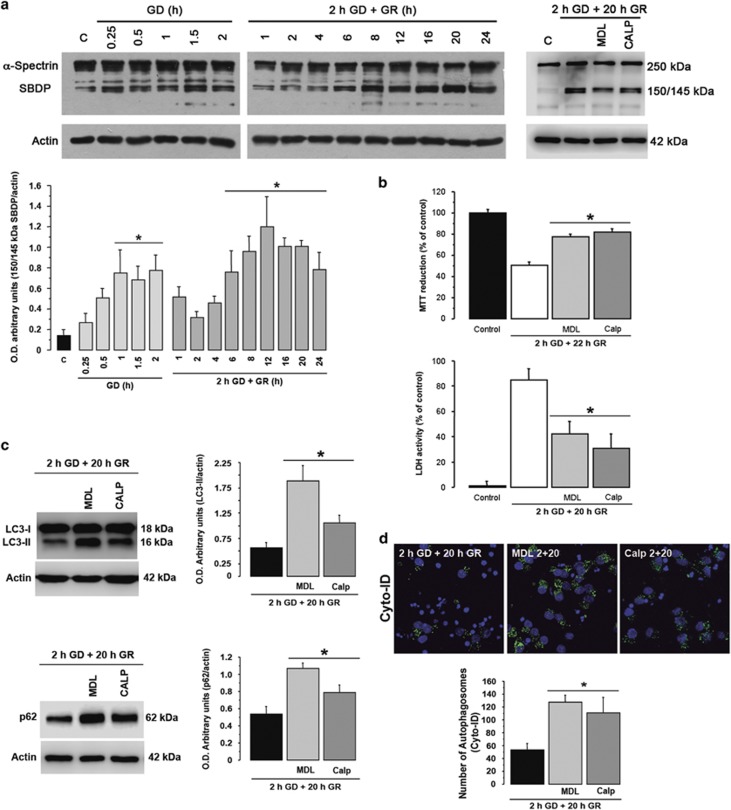
Figure 5.
Calpain is activated in cortical cultures exposed to GD/GR. Representative immunoblots and quantification of the calpain cleaved 150/145 kDa spectrin fragments at different times of GD and GR, and effect of calpain inhibitors (a). MTT reduction and LDH activity of cultures exposed to GD/GR with or without calpain inhibitors. MDL or Calpastatin were added during GR (b). Representative immunoblots and quantification LC3-II/actin and p62/SQSTM1/actin levels in cultures exposed to GD/GR with or without calpain inhibitors (c). Representative images and quantification of the number of autophagosomes in cultures exposed to GD/GR with or without calpain inhibitors (d). Bars represent mean±S.E.M. (n=4 a; n=4–10 b; n=6–7 c, n=3–4 d). Data were analyzed by one way ANOVA followed Fisher’s post hoc test *P<0.05 versus control or GD

