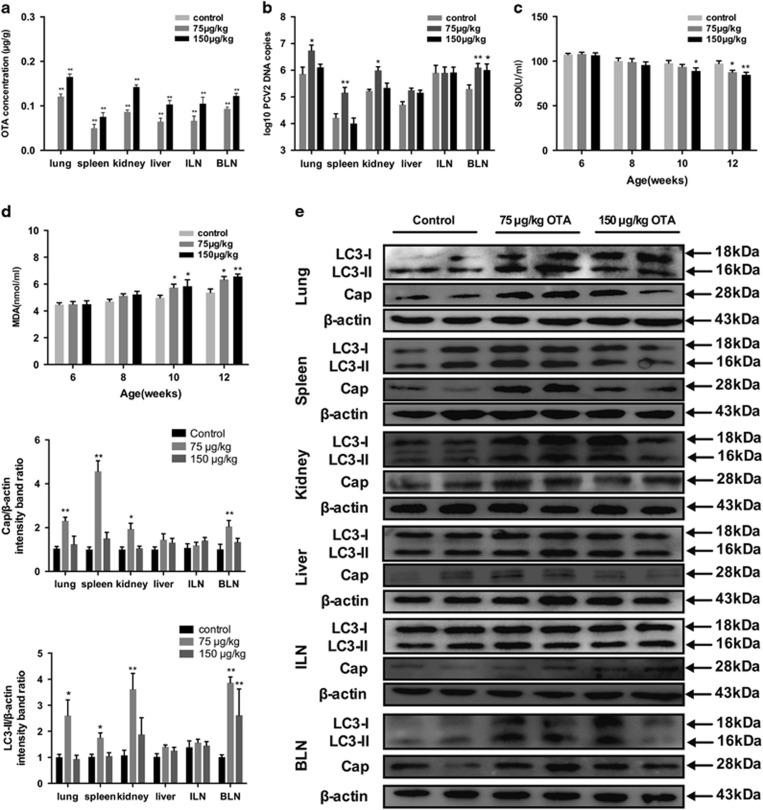
Figure 11.
OTA, SOD and MDA concentrations, PCV2 DNA copies and western blotting of LC3 and cap in tissues of pigs fed a basal diet or a basal diet containing OTA at 75 and 150 μg/kg. (a) OTA concentrations in lung, spleen, kidney, liver, ILN, and BLN of pigs fed the basal diet (control) or the basal diet with added OTA at 75 and 150 μg/kg. (b,c) Levels of (b) SOD and (c) MDA in serum from pigs fed the basal diet (control) or the basal diet containing OTA at 75 or 150 μg/kg. (d) PCV2 DNA copies in lung, spleen, kidney, liver, ILN, and BLN of the same pigs were assessed by real-time PCR. (e) The expression levels of LC3 and cap in lung, spleen, kidney, liver, ILN, and BLN of the same pigs were measured by western blotting. The data are presented as means±S.E. of three independent experiments. Statistical significance compared with the control is indicated by *P<0.05 and **P<0.01

