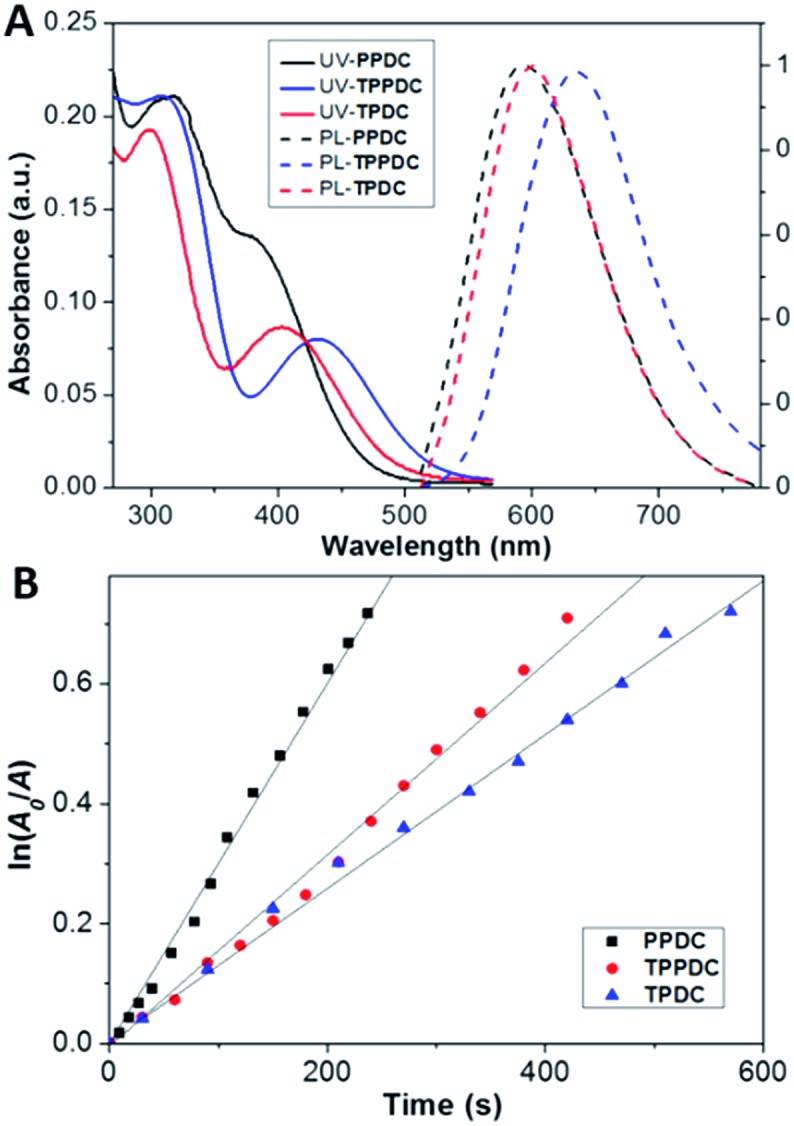
Fig. 3. (A) UV-vis absorption (solid lines) and normalized photoluminescence (PL) spectra (dashed lines) of 10 μM each of PPDC, TPDC and TPPDC in DMSO/water (v/v = 1/99). (B) The decomposition rates of ABDA by PPDC, TPDC and TPPDC; A 0 and A are the absorbance of ABDA in the presence of the AIEgen PSs at 378 nm before and after irradiation, respectively.

