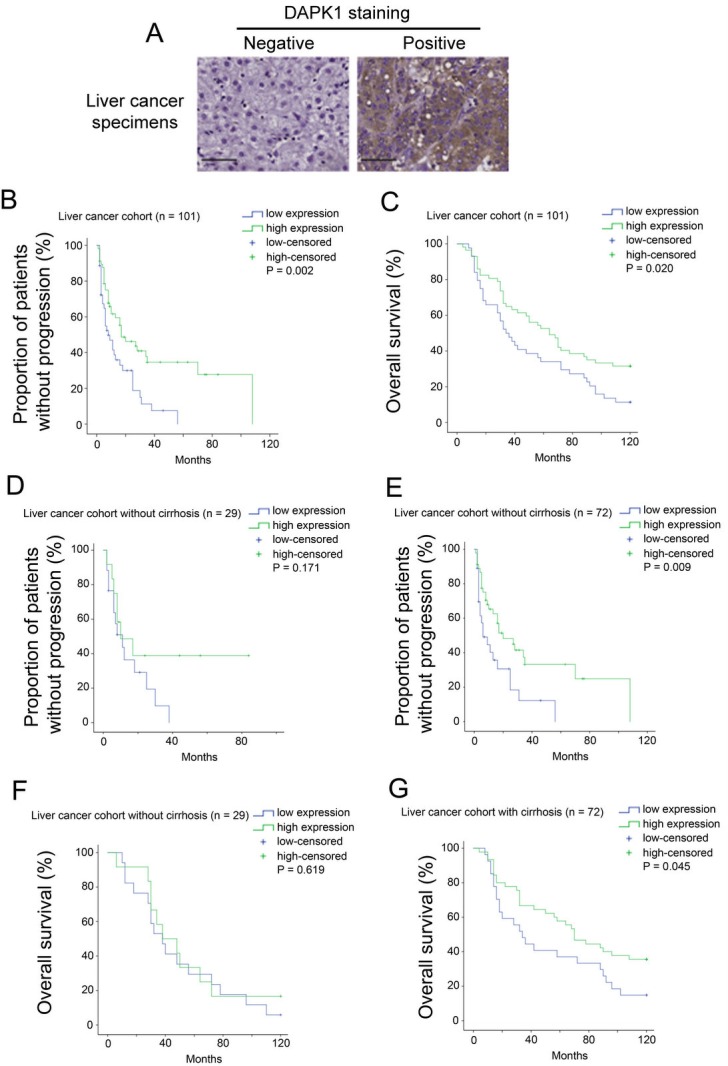
Figure 2. Protein expression of DAPK1 in liver cancer specimens.

(A) Representative immunohistochemistry images for liver cancer specimens stained negative and positive for DAPK1. Scale bar = 100 µm. (B) Kaplan–Meier time to progression curves for patients with different types of staining for DAPK1 in the in-house liver cancer cohort. (C) Kaplan–Meier overall survival curves for patients with different types of staining for DAPK1 in the in-house liver cancer cohort. (D) Kaplan–Meier time to progression curves for patients with different types of staining for DAPK1 in patients without cirrhosis. (E) Kaplan–Meier time to progression curves for patients with different types of staining for DAPK1 in patients with cirrhosis. (F) Kaplan–Meier overall survival curves for patients with different types of staining for DAPK1 in patients without cirrhosis. (G) Kaplan–Meier overall survival curves for patients with different types of staining for DAPK1 in patients with cirrhosis.
